Back from the BoRdeaux conference
Here is a quick wrap up of the BoRdeaux conference. I won’t detail the conference program itself, but just drop some words on packages that were presented together with their applications (in various fields: epidemiology, social sciences, teaching, high dimensional data, chemometrics).
Multivariate data analysis
Stéphanie Bougeard talked about two new functions in the ade4 package aiming at the analysis of K+1 tables (several blocks of explanatory variables and a block of response variables). I can’t find those functions, mbpls and mbpcaiv, but they look interesting. I wonder how they compare to RGCCA or PLS path modeling (e.g., plspm or semPLS).
Her slides from other conferences include more mathematical details: AGROSTAT 2010, CARME 2011. Currently, the key paper seems to be: Bougeard, S, Qannari, EM, Rose, N (2011). Multiblock redundancy analysis: interpretation tools and application in epidemiology. Journal of Chemometrics, 25(9): 467–475.
Other (related) papers of interest:
- Bougeard, S, Qannari, EM, Lupo, C, and Hanafi, M (2011). From Multiblock Partial Least Squares to Multiblock Redundancy Analysis. A Continuum Approach. Informatica, 22(1): 11-26.
- Bougeard, S, Qannari, EM, Lupo, C, and Chauvin, C (2011). Multiblock redundancy analysis from a user’s perspective. Application in veterinary epidemiology. Electronic Journal of Applied Statistical Analysis, 4(2): 203-214.
I’ve also learned that ade4 graphics capabilities will be rebased on the lattice package, allowing for complex layout on graphical device (Alice Julien-Laferriere’s talk). This was done using S4 classes on top of existing functions visible to the user (s.class, dudi.pca, etc.).
Aurélie Thébault presented her work on locally-weighted PLS regression, with applications in infrared spectral analysis. The idea is to introduce a local calibration stage, before computing PLS components. The idea of local PLS is to predict new observations from a subset of the original samples that resemble the characteristics of these new observations (weighting process). This seems to be highly specific of near-infrared spectroscopy, but it might be interesting for signal processing.
The PCAmixdata was discussed by Vanessa Kuentz-Simonet. This is a package that deals with VARIMAX rotation in factor analysis: Chavent, M, Vanessa, K, and Saracco, J (2011), Orthogonal rotation in PCAMIX (arXiv:1112.0301). At UseR! 2011, there was a related talk on the selection of variables by those authors: ClustOfVar: an R package for the clustering of variables.
Other interesting papers I have to read or reread:
- Kiers, HAL and Krijnen, W (1991). An efficient algorithm for PARAFAC of three-way data with large numbers of observation units, Psychometrika, 56(1): 147-152.
- Takane, Y and Shibayama, T (1991). Principal component analysis with external information on both subjects and variables, Psychometrika, 56(1): 97-120.
- Takane, Y, Kiers, HAL, and de Leeuw, J (1995). Component analysis with different sets of constraints on different dimensions. Psychometrika, 60(2): 259-280.
- Kiers, HAL (1991) Simple structure in component analysis techniques for mixtures of qualitative and quantitative variables. Psychometrika, 56: 197-212.
- Lorenzo-Seva, U, van de Velden, M, and Kiers, HAL (2009). CAR: A MATLAB Package to Compute Correspondence Analysis with Rotations. Journal of Statistical Software, 31(8).
The mixOmics package has been updated with new functions, including Independent Principal Component Analysis. It now has an official website where more information are available, and a there is also a mixOmics wizard where users can see online illustrations and get explanation of the techniques used therein (good point for reproducible research!).
Model-based clustering
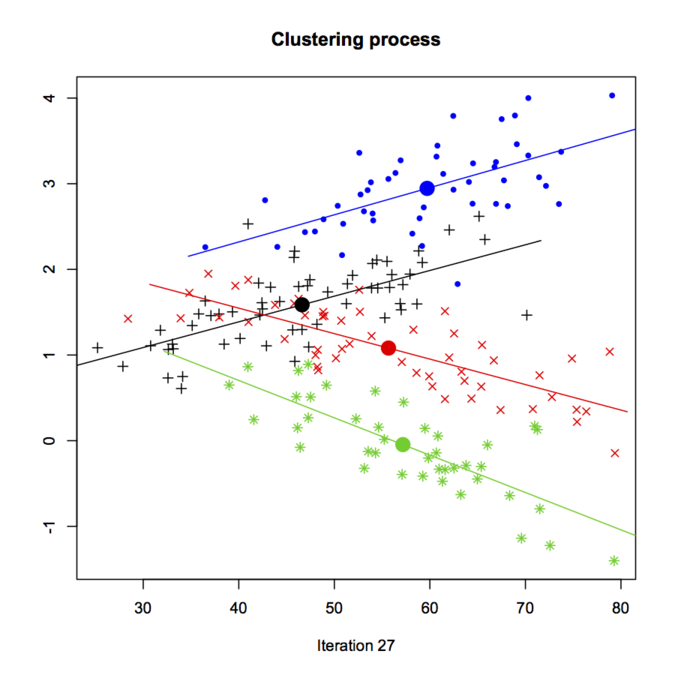
Charles Bouveyron provided a general overview of the HDclassif package (but see the JSS paper, HDclassif: An R Package for Model-Based Clustering and Discriminant Analysis of High-Dimensional Data), which is for supervised and unsupervised classification. There was a nice demo of clustering with the crabs dataset, which can be found in demo_hddc(). Below is a screenshot from running model-based clustering with the EM algorithm, k-means initialization for cluster centres, and AkBkQkDk model for the general variance-covariance structure (see section 2.1 of the JSS paper for more explanation).
Florent Langrognet presented the Rmixmod package; this is a porting from the mixmod project for high performance model-based cluster and discriminant analysis, which comes as a C++ library with command-line utilities and a MATLAB frontend. Interestingly, this package also works with semi-supervised problem, and it allows for case weighting.