User-friendly statistical packages
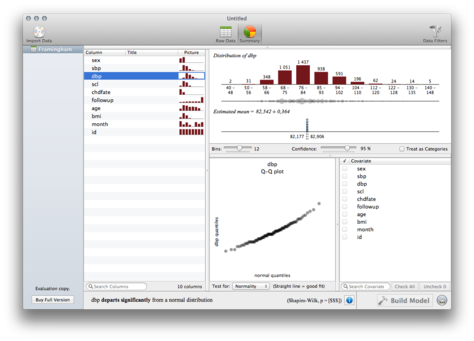
Here is a newcomer in the world of “user-friendly” statistical packages: Wizard (Mac only).
This software features an all-in-one approach to data analysis and visualization: you start with a spreadsheet of your raw data, and you can ask for a description of it with two clicks (select a ‘summary’ button, and then select a variable. Several graphics are proposed, depending on the type of data, but sadly pie charts are offered as default for categorical data. Moreover, tests of adjustment to a theoretical probability distribution are automagically printed (the trial version just doesn’t print associated p-values). That’s not necessarily something that I would look at when first approaching a new dataset, and I would like to be able to display several variables at once.
About statistical models, it is limited to multivariate regression. The tutorial says that Wizard can perform weighted linear regression as well as logistic regression, and I tested them. In fact, ANOVA is performed in the same way as linear regression, i.e. as linear models (no ANOVA table, no post-hoc tests, etc.). At least, visualization of model residuals is there.
It is rather expensive, and of course should be unlocked through App Store. One positive aspect of this software is that it allows to work with different datasets at the same time, and it can import Stata, SPSS or R data files. Things I don’t like really much is how it enforces a constrained view of the data at hand. However, given its purpose–Data Analysis for the Non-Statistician–it is already a good thing to offer visual displays for summary statistics and model fits in a systematic manner.
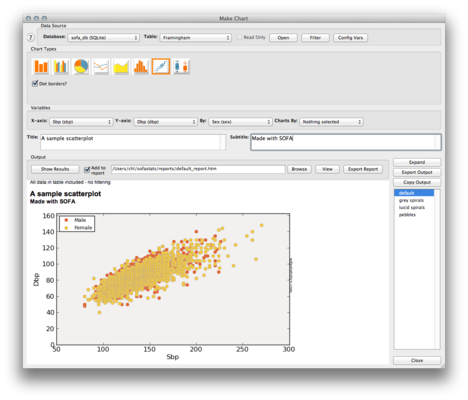
Some months ago, I also tested SOFA (Statistics Open For All), which is cross-platform and open source. It’s much bigger in size (139.2 Mo compared to 4.9 Mo for Wizard), but it is based on Python (with an SQLite backend) so you can even check how computations are done. And of course, it’s free.
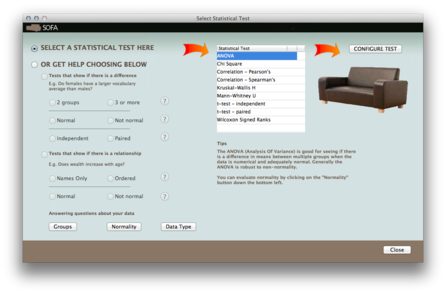
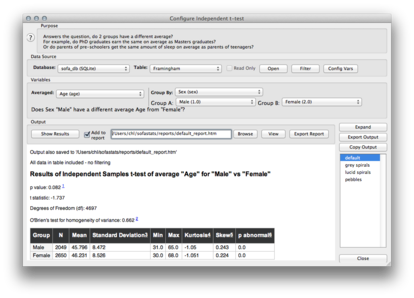
The number of tests that are available is rather limited, as shown below. There’s a wizard to help the beginner choose between different tests, depending on the question of interest but obviously it won’t tell you what to do with a response variable having ordered response categories. I found that running a simple t-test for independent samples was quite long, even though the dataset in use was quite limited (4699 records).
In both cases, I’m seriously missing the ability to write commands myself and have to rely on push buttons and menus. I understand that this is what is supposed to make these statistical packages so “friendly”, but well it looks like only Stata succeeded in providing both a handy set of menu-driven utilities and a command-line. From my limited experience, JMP is really great for interactive data visualization and it includes main techniques for statistical modeling but its scripting facilities are too cryptic to me (at first sight, because I really did not investigate this much). Contrary to SAS, it is available for Mac users which is a great thing as it can import SAS and SPSS databases without difficulty.
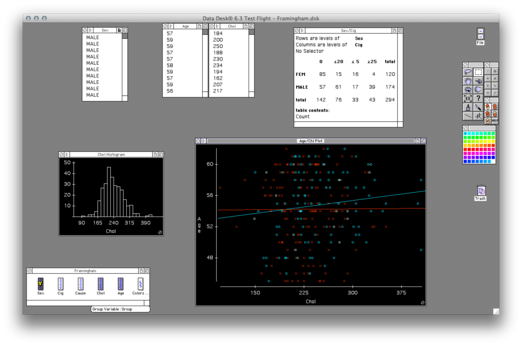
Another application for interactive statistical analysis is Data Desk. Initially, Data Desk was also a Mac-only application, but it has been made available for Windows users 15 years ago. It is a really nice tool that allow to visualize multivariate dataset with brushing and linking in quick steps. It supports some basic techniques for statistical modeling like linear and non-linear regression. I think it should have been a serious add-on in the 90’s. Now, we have GGobi (or the new Qt interface, cranvas and the like) which offers almost exactly the same, with projection pursuit, multidimensional scaling and a connection with R. (This is the reason why I never bought Data Desk.)
The problem with so-called “user-friendly” packages to data analysis is always the same: what if I tell you that two records were inadvertently inserted in your data and that you must redo everything? If you haven’t recorded each step somehow, then you just have to go through each button and menu again. This is the problem with statistical UIs that don’t offer any way to store your commands and replay them at any time, and I’m not even talking about reproducible research: I’m just talking about how to manage statistical projects in an economical albeit efficient manner.