ArXiving on May 2018
Here is a quick overview of some papers from the ArXiv. (And yes it was supposed to be published in May, and yes it is partly incomplete.)
David M. Blei, Alp Kucukelbir & Jon D. McAuliffe (2016). Variational Inference: A Review for Statisticians
When one wants to approximate a complex (posterior) probability density, Variational Inference is a great technique to find the closest probability density as measured by Kullback-Leibler divergence. Here is a short introduction on Princeton for those who want it short (see also this tutorial). Otherwise, I highly recommend spending some time with this review which deals with Bayesian mixture of Gaussians and mean-field variational family.
Hanqing Zhao & Yuehan Luo (2018). An O(N) Sorting Algorithm: Machine Learning Sorting
In this reasearch paper, the authors present a porbabilistic-based algorithm with a complexity of $\mathcal{O}(N\cdot M)$, where $M$ is small constant reflecting the number of neurons in the hidden layers of a Neural Network. Note that radix sort and counting sort are also $\mathcal{O}(N)$ (up to a constant $k$, whether it be the number of digits to sort or simply their range). Note also that Don Knuth wrote a fabulous book on sorting algorithms. Now, this is the era of big data and machine learning, so if you care about those hot topics, check for yourself.
Gavin L Simpson (2018). Modelling palaeoecological time series using generalized additive models
I read this preprint because it is written by a very bright guy I followed on Stack Exchange and his personal website for a long time now. I heard about that paper on Twitter. As I now he is quite proficient with R and well versed into the Generalized Additive Model (GAM), I was happy to take some time to review that paper. If you are interested in this kind of stuff, you should really take a look at his blog. This paper deals with statistical analyses of trends in palaeoenvironmental time series using GAMs. This family of models allows not only to provide smoothand cross-validated estimates of trend in time, but also to assess model uncertainty and, to some extent, to test formal hypothesis between alternate models. This paper serves both as an introduction to using GAMs in a correct and sensible way, but also as a hand on tutorial with real datasets.

Thomas Hofmann, Bernhard Schölkopf & Alexander J. Smola (2008). Kernel Methods in Machine Learning
This is an old publication that I found while looking to Bernhard Schölkopf’s webpage on MPI. In a few words,
Traditionally, theory and algorithms of machine learning and statistics has been very well developed for the linear case. Real world data analysis problems, on the other hand, often require nonlinear methods to de- tect the kind of dependencies that allow successful prediction of properties of interest. By using a positive definite kernel, one can sometimes have the best of both worlds. The kernel corresponds to a dot product in a (usually high-dimensional) feature space. In this space, our estimation methods are linear, but as long as we can formulate everything in terms of kernel evalu- ations, we never explicitly have to compute in the high-dimensional feature space.
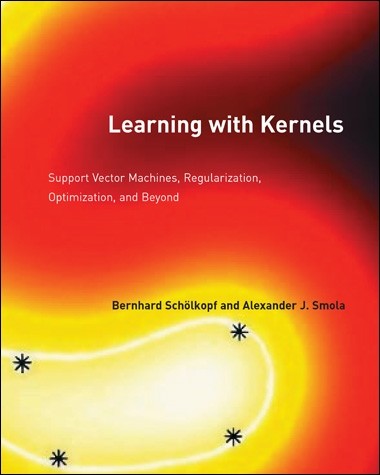
Overall, I found that this article provides a thorough overview of kernel methods, and if you want an extended version, go check the definitive book written a few years before by the same authors:

Victor Dibia & Çagătay Demiralp (2018). Data2Vis: Automatic Generation of Data Visualizations Using Sequence to Sequence Recurrent Neural Networks
This is a recent paper on automating the data visualization process, not from IDL this time. I always take a look around what the IDL lab from the University of Washington recently released, in case there is something new and as big as Data Voyager (paper). In my view, designing effective visualizations and guiding users in visual data explorations are separate aspects of automatic data visualization, although both rely on recommender systems to some extent. Several data viz software rely on a declarative specification, in the spirit of Wilkinson’s Grammar of Graphics, see e.g. the R ggplot package and Vega Javascript implementation. In the present paper, the authors used Deep Neural Networks (DNN) to build a generative model relying on the idea of a sequence to sequence translation problem. In fact, the training dataset they used was based on Vega-Lite examples for a range of basic charts and aggregating operations. Data2Vis is available online, but I wasn’t able to run the demo version due to server errors at the time of this writings.