ArXiving on October 2022
Approximating Persistent Homology for Large Datasets (https://arxiv.org/abs/2204.09155)
At first sight, it sounded really interesting, especially since the authors used bootstrap, and perhaps with bioinformatics applications in mind:
Persistent homology (…) produces a statistical summary in the form of a persistence diagram, which captures the shape and size of the data.
Then, I realized that it’s a hard paper (for me at least). I’ll keep it under my hat for later, when I’ll have clearer ideas.
A new preferential model with homophily for recommender systems (https://arxiv.org/abs/2204.11819)
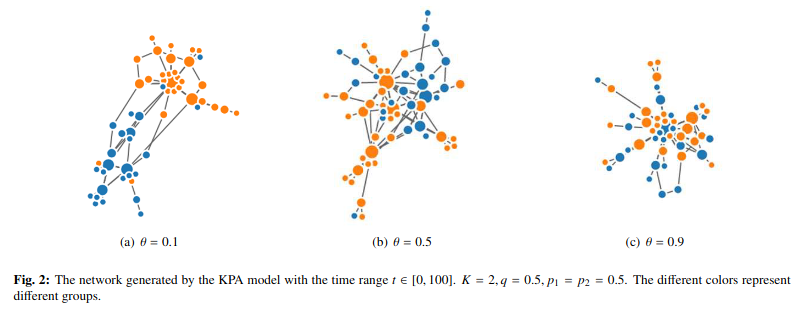
I’ve been teaching the basis of recommender systems in an engineering school for two years. I liked it, especially when discussing matrix factorization algorithms and Co. Applications speak for themselves (everybody knows Amazon or Spotify, right?), and I missed Seth Brown’s beer recommendation engine. This paper is more about social networks and preferential attachment (rich-get-richer and homophily). The authors show that the number of vertices in their K-groups preferential attachment model follows a power law, and they dscuss two applications on real web data.

Locality Sensitive Hashing for Structured Data: A Survey (https://arxiv.org/abs/2204.11209)
Locality sensitive hashing (LSH) is used to hash alike items into the same buckets with high probability, which means it can be used as a data reduction or clustering method, bypassing any supervised learning process. However, this usually does not apply to ordered items, like trees, graphs or sequences. The authors survey relevant techniques for such hierarchical LSH algorithms.
Marginal log-linear models and mediation analysis (https://arxiv.org/abs/2204.08538)
Yet another paper on log-linear analysis, this time in the context of mediation analysis (a hot topic in psychiatric and psychological studies in the last ten years when people realized that causal analysis may or should not be that easy).
Simultaneous confidence intervals for the interpretation of primary and secondary effects in factorial designs without a pre-test on interaction (https://arxiv.org/abs/2204.08336)
Here, the author discusses the use of parametric or non-parametric simultaneous confidence intervals between the levels of a primary factor for both separate and joint secondary factor levels in an unbalanced factorial design with 2 or 3 factors (where one of the factor has more than 2 levels).
A Note on Simulation-Based Inference by Matching Random Features (https://arxiv.org/abs/2111.09220)
We can, and should, do statistical inference on simulation models by adjusting the parameters in the simulation so that the values of randomly chosen functions of the simulation output match the values of those same functions calculated on the data.
It reminds me of raking or margin adjustment in survey analysis.
♪ Queens of the Stone Age • Long Slow Goodbye