ArXiving on November 2023
The 4+1 Model of Data Science (https://arxiv.org/abs/2311.07631)
I’m still not a big fan of the term data science (as a discipline), and I much prefer statistician or data engineer, but let’s forget about that for a moment. In this article, Rafael Alvarado offers to extend the consensual view according to which data science lies at the intersection between three main domains of expertise: computer science and technology, mathematics and statistics, and domain knowledge, which I found even more confusing. Specifically, he considers the following four main domains: value, design, systems, and analytics, to which a fifth domain may be added, namely practice. In a related article, his review led him to conclude that the three driving factors of all the buzz around the sexiest job the 21st century are “(1) the long-standing opposition between data analysts and data miners that continues to animate the field, (2) an established definition of the term as the practice of managing and processing scientific data that has been occluded by recent usage, and (3) the phenomenon of data impedance.” Much ado about nothing in my opinion, unless you consider that the volume and nature of data being processed these days implies a major change in terminology. But is it really that important if it’s just a question of terminology? Because the job remains fundamentally the same, after all.
Resampling-free bootstrap inference for quantiles (https://arxiv.org/abs/2202.10992)
A paper I read last year, thanks to Evan Miller, but go read his own blog post which covers pretty all the math. While the authors originally proposed a Poisson model for bootstrapping differences in quantiles, whereby each observation in the original sample is included in each bootstrap sample according to a Poisson distribution with parameter 1, Evan Miller suggested an approximation which involves a Bessel function.
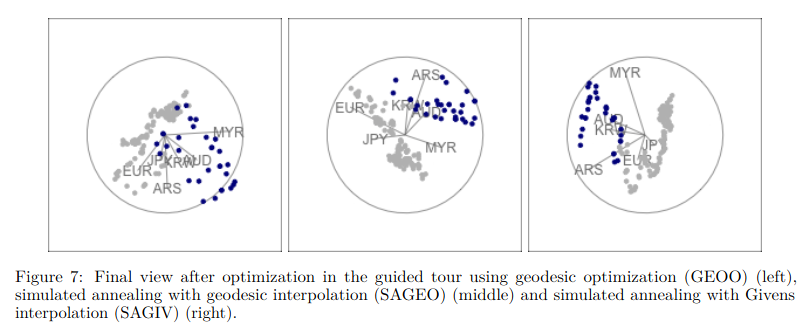
Frame to frame interpolation for high-dimensional data visualisation using the woylier package (https://arxiv.org/abs/2311.08181)
A new paper by Dianne Cook, whose contributions I have always greatly appreciated since I discovered ggobi (the website is still alive apparently). The “grand tour” (and other derivatives) is a method that allows to view data in more than three dimensions using linear projection, essentially by using rotations of a lower-dimensional projection in high-dimensional space. I’ve only seen this implemented efficiently in ggobi, but there may have been other attempts. Frames are stacked together with small interpolation to create a smooth motion. However, projection are usually rotationally invariant (when using geodesic interpolation algorithm) which may not be a desirable property when, e.g., we are looking for non-linear association in a high-dimensional dataset. The present package works along the tourr package.
Visualizing adverse events in clinical trials using correspondence analysis with R-package visae (https://arxiv.org/abs/2101.03454)
Although I’m no longer involved in medical statistics, I keep an eye open on data visualization and applied methodology in the field. This article drew my attention a few weeks ago because it relies on multivariate projection methods, in this case correspondance analysis and biplots. There’s an associated GitHub repository where you will find code (shiny and ggplot) and illustrations. The advantage of biplots as summary displays is that they help highlighting complex relationship (or, in some cases, interactions). For instance, in the associated BMC paper the authors published alongside this preprint, they used biplots to highlight discrepancies between single agent treatments and their combinations with oxaliplatin at all levels of AE classes, which explain most of the variability among treatments.
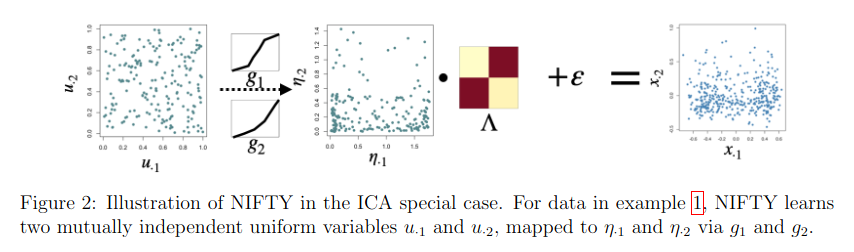
Identifiable and interpretable nonparametric factor analysis (https://arxiv.org/abs/2311.08254)
Contrary to Gaussian models or deep neural networks, which show poor performance in terms of identifiability, interpretability, and reproducibility, the authors propose to use the “NIFTY framework, which parsimoniously transforms uniform latent variables using one-dimensional nonlinear mappings and then applies a linear generative model.” Briefly stated, such an approach allows to work with a standard linear latent factor model, which is easier to interpret compared to the aforementioned models, which amounts to a Bayesian independent component analysis under certain conditions.
Generating Signed Permutations by Twisting Two-Sided Ribbons (https://arxiv.org/abs/2311.06974)
An interesting review of algorithms available to generate permutations, and specifically signed permutations which are permutations of $[n]$ objects with a $\pm$ sign. In the case of permutations, there are $n!$ solutions, while for signed permutations there are $2^n\cdot n!$ solutions. Not something I am really interested in at the moment, but I’ll keep it in mynd in case I need it. There are a lot of nice illustrations, BTW.
♪ Mini Trees • Cracks in the Pavement