ArXiving on March 2026
Again, I’m so late on this reading list (originally drafted in April).
Stress-Testing Assumptions: A Guide to Bayesian Sensitivity Analyses in Causal Inference
While observational data are routinely used to estimate causal effects of biomedical treatments, doing so requires special methods to adjust for observed confounding. These methods invariably rely on untestable statistical and causal identification assumptions. When these assumptions do not hold, sensitivity analysis methods can be used to characterize how different violations may change our inferences. The Bayesian approach to sensitivity analyses in causal inference has unique advantages as it allows users to encode subjective beliefs about the direction and magnitude of assumption violations via prior distributions and make inferences using the updated posterior. However, uptake of these methods remains low since implementation requires substantial methodological knowledge. Moreover, while implementation with publicly available software is possible, it is not straight-forward. At the same time, there are few papers that provide practical guidance on these fronts. In this paper, we walk through four examples of Bayesian sensitivity analyses: 1) exposure misclassification, 2) unmeasured confounding, and missing not-at-random outcomes with 3) parametric and 4) nonparametric Bayesian models. We show how all of these can be done using a unified Bayesian “missing data” approach. We also cover implementation using Stan, a publicly available open-source software for fitting Bayesian models. To the best of our knowledge, this is the first paper that presents a unified approach with code, examples, and methodology in a three-pronged illustration of sensitivity analyses in Bayesian causal inference. Our goal is for the reader to walk away with implementation-level knowledge.
This paper is about sensitivity analysis in observational studies using Bayesian methods. Such an approach allows to handle missing data as unobserved quantities (like model parameters) while sampling form the joint posterior of parameters and missing quantities using Stan to make inference on the ATE, $\psi$.
Efficient Tests for Testing in Two-way ANOVA under Heteroscedasticity
New tests are developed for two-way ANOVA models with heterogeneous error variances. The testing problems are considered for testing the significant interaction effects, simple effects, and treatment effects. The likelihood ratio tests (LRTs) and simultaneous comparison tests are derived for all three problems. Hill climbing algorithms have been proposed to compute the maximum likelihood estimators (MLEs) of parameters under the restrictions on the null and alternative hypotheses. It is proved that the proposed algorithms converge to the MLEs. A parametric bootstrap algorithm is provided for the computation of the critical points. The simulated power values of the proposed tests are compared with two existing tests. For testing main effects in the additive ANOVA model, the LRT appears to be about 30% to 50% gain in power over the available tests. Also, the proposed tests for the interaction and simple effects are seen to have comparable power and size performance to the existing tests. The behavior of the proposed tests under the non-normal error distribution is also discussed. Four real data sets are used to demonstrate the application of the proposed tests. A software package is made in `R’ to make it simple to apply the tests to experimental data sets.
Balanced ANOVA designs in which variance are not too disproportionate from one condition to the other make things easier (orthogonal sum of squares, nice behavior of F- or t-tests). There’s rarely any need to test for the homogeneity of variance in balanced design, BTW – those preliminary tests even perform worse than ANOVA tests when its ideal conditions do not hold.1 Hill climbing algorithms coupled to parametric bootstrap are discussed in this article.
Sample Size Calculations for Developing Clinical Prediction Models: Overview and pmsims R package
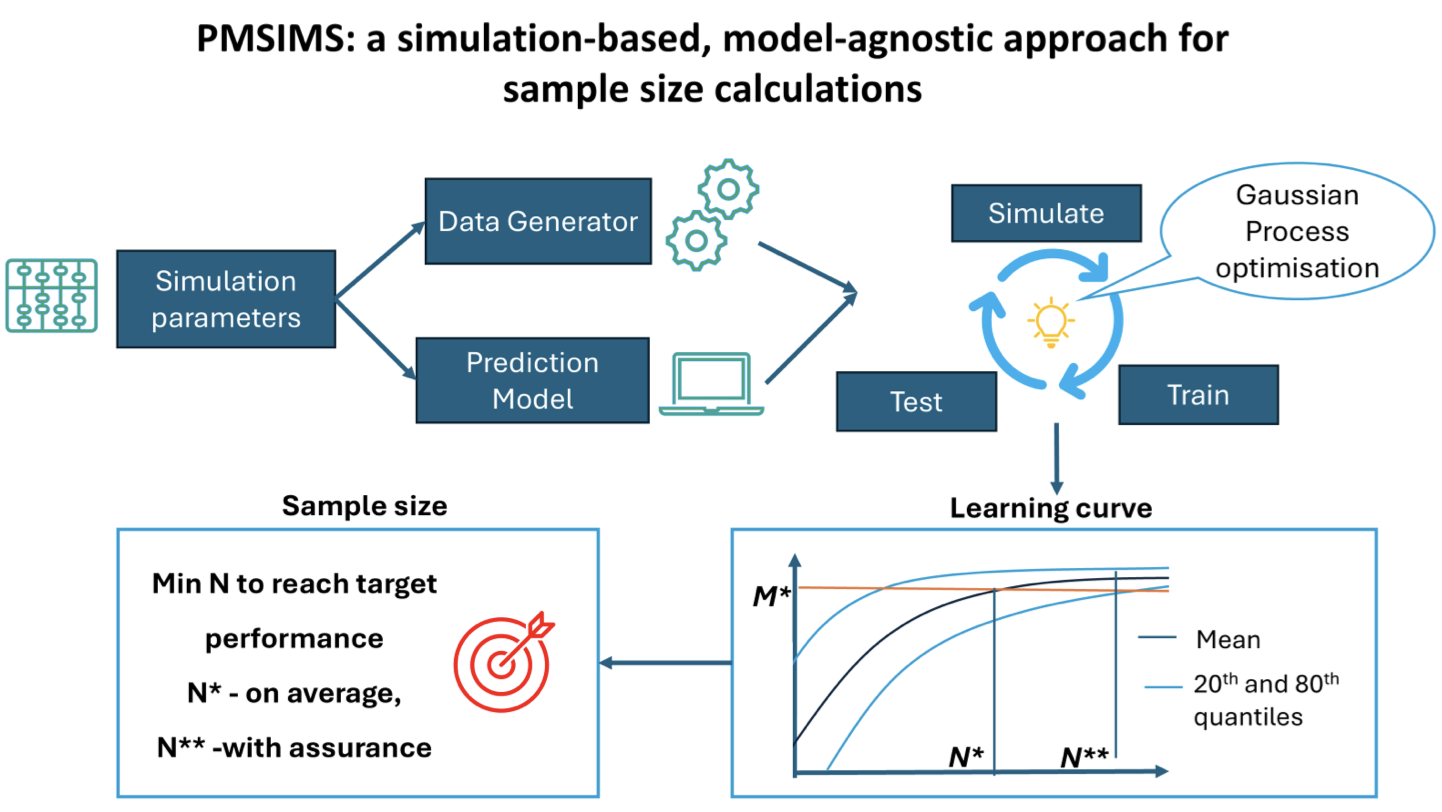
Background: Clinical prediction models are increasingly used to inform healthcare decisions, but determining the minimum sample size for their development remains a critical and unresolved challenge. Inadequate sample sizes can lead to overfitting, poor generalisability, and biased predictions. Existing approaches, such as heuristic rules, closed-form formulas, and simulation-based methods, vary in flexibility and accuracy, particularly for complex data structures and machine learning models. Methods: We review current methodologies for sample size estimation in prediction modelling and introduce a conceptual framework that distinguishes between mean-based and assurance-based criteria. Building on this, we propose a novel simulation-based approach that integrates learning curves, Gaussian Process optimisation, and assurance principles to identify sample sizes that achieve target performance with high probability. This approach is implemented in pmsims, an open-source, model-agnostic R package. Results: Through case studies, we demonstrate that sample size estimates vary substantially across methods, performance metrics, and modelling strategies. Compared to existing tools, pmsims provides flexible, efficient, and interpretable solutions that accommodate diverse models and user-defined metrics while explicitly accounting for variability in model performance. Conclusions: Our framework and software advance sample size methodology for clinical prediction modelling by combining flexibility with computational efficiency. Future work should extend these methods to hierarchical and multimodal data, incorporate fairness and stability metrics, and address challenges such as missing data and complex dependency structures.
Again a paper that offers an R solution, pmsims, to a power-related issue. This time this study focus on clinical prediction models and put emphasis on the underlying risk criteria – mean-based (find the smallest n such that the expected performance exceeds a target level) vs. assurance-based (the same idea except that it requires that the performance exceeds the target level with a high probability, e.g. 80%) criteria. Compared to rule of thumb regarding number of events per variable, or closed form analytic formulae (which I used a lot in the past) simulation-based approached offer the advantage of allowing for more flexible design, especially multilevel or nested data or high dimensional dataset, and to relax distributional assumptions.
Extending the saemix package for R to fit non Gaussian outcomes
Background and Objectives: Longitudinal data are increasingly collected in clinical trials to provide information on treatment action and disease evolution. The trajectory of continuous biomarkers such as target hormone concentrations or viral loads can then be modelled in relationship to the occurrence of events such as recovery or hospitalisation. Other studies may include repeated measurements of discrete pain scores, number of episodes (count) or occurrence of events (survival). Non-linear mixed-effect models (NLMEM) can handle individual differences in trajectories while modelling the underlying population evolution and are the natural choice for their analysis. The saemix package for R is one of the few open-source solutions and the most flexible. In this paper, we extend it to accommodate a variety of models for non-Gaussian data. Methods: The saemix package estimates parameters through the Stochastic Approximation Expectation-Maximisation (SAEM) algorithm. Within the package, non-Gaussian models are specified by their log-likelihood functions, affording maximal control over model formulation. We extend estimation algorithms as well as exploratory and diagnostic plots for non-Gaussian data. Bootstrap approaches were implemented to estimate parameter uncertainty. To evaluate the performance of saemix, we performed a simulation study based on the toenail dataset, containing repeated binary data from a randomised clinical trial. Results: saemix showed good performance to recover the true parameter values in the simulation study, and was stable across different starting values for the parameters. An algorithm jointly searching for covariate and interindividual variability model was also implemented to build the covariate model and applied to categorical and survival-type data.
I first heard of the SAEM framework when working with mixed-effect modeling back in 2009 for genetic studies. It was implemented in MATLAB, IIRC, and it was targeting pharmacological compartmental models or dose-response design. The present R package works with survival and non-Gaussian data specified by their log-likelihood functions and the precision of parameter estimate is assessed using bootstrap.
Trajectory-informed graph-based clustering for longitudinal cancer subtyping
Cancer subtyping plays a crucial role in informing prognosis and guiding personalized treatment strategies. However, conventional subtyping approaches often rely on static, biopsy-derived scores that hardly capture the biological heterogeneity and temporal evolution of the disease. In this study, we propose a novel trajectory-informed clustering method for cancer subtyping that integrates multi-modal clinical data and longitudinal patient trajectories. Our method constructs a patient similarity graph using time-varying imaging-derived features, clinical covariates, and transitions among key clinical states such as therapy, surveillance, relapse, and death. This graph structure enables the identification of patient subgroups that are not only phenotypically and genotypically distinct but also aligned with patterns of disease progression. We position our approach within the landscape of existing subtyping methods and highlight its advantages in terms of temporal modeling and graph-based interpretability. Through simulation studies and application to a real world dataset of liver metastases, we demonstrate the ability of our framework to uncover clinically relevant subtypes with distinct prognostic trajectories. Our results underscore the potential of trajectory-informed clustering to enhance personalized oncology by bridging cross-sectional biomarkers with dynamic disease evolution.
This articles discusses cancer subtyping based on patient similarity graph using time-varying imaging-derived features and multimodal clinical auxiliary information: covariates, transitions among key clinical states such as therapy, surveillance, relapse, and death. “This graph structure enables the identification of patient subgroups that are not only phenotypically and genotypically distinct but also aligned with patterns of disease progression.”
Cancer Survival Rates Are Misleading
Five-year cancer survival rates are widely reported and often interpreted to mean that early detection saves lives, that a late fatal diagnosis would have been prevented by earlier detection, and that increasing survival over time proves better treatment. This expository article explains why such inferences are not supported by survival statistics alone. A simple Markov model of tumor progression, calibrated to patterns like those in SEER data, shows that high survival after early diagnosis, large gaps between early and late stage, and improving survival can all appear even when treatment is ineffective and screening does not reduce mortality. The discussion ties these points to the clinical literature and argues that randomized trials and mortality outcomes are needed to support screening and treatment claims; five-year survival alone provides little actionable evidence and is easily misread.
Early detection saves lives, or increasing survival over time proves better treatment? Allen Downey makes use of simple Markov model of tumor progression to show that survival rates alone are not informatice enough to make such strong claims, especially in light of the counterfactuals that he details throughout his paper.
A practical introduction to ODE modelling in Stan for biological systems
Integrating dynamical systems models with time series data is a central part of contemporary mathematical biology. With the rich variety of available models and data, numerous methods and computational tools have been developed for these purposes. One such tool is Stan, a freely available and open-source probabilistic programming framework that provides efficient methods for estimating model parameters from data using computational Bayesian inference algorithms. Stan includes built-in mechanisms for working with ordinary differential equation (ODE) models, which are widely used in mathematical biology and related fields to study simulated, experimental, and real-world systems that change over time. Through step-by-step worked examples, including both pedagogical toy models and applications with real data, this article provides a practical, self-contained introduction to performing parameter estimation and model evaluation for first-order linear and nonlinear ODE models in Stan. The article also explains key statistical methods that underpin Stan and discusses computational Bayesian modelling in the context of biological applications.
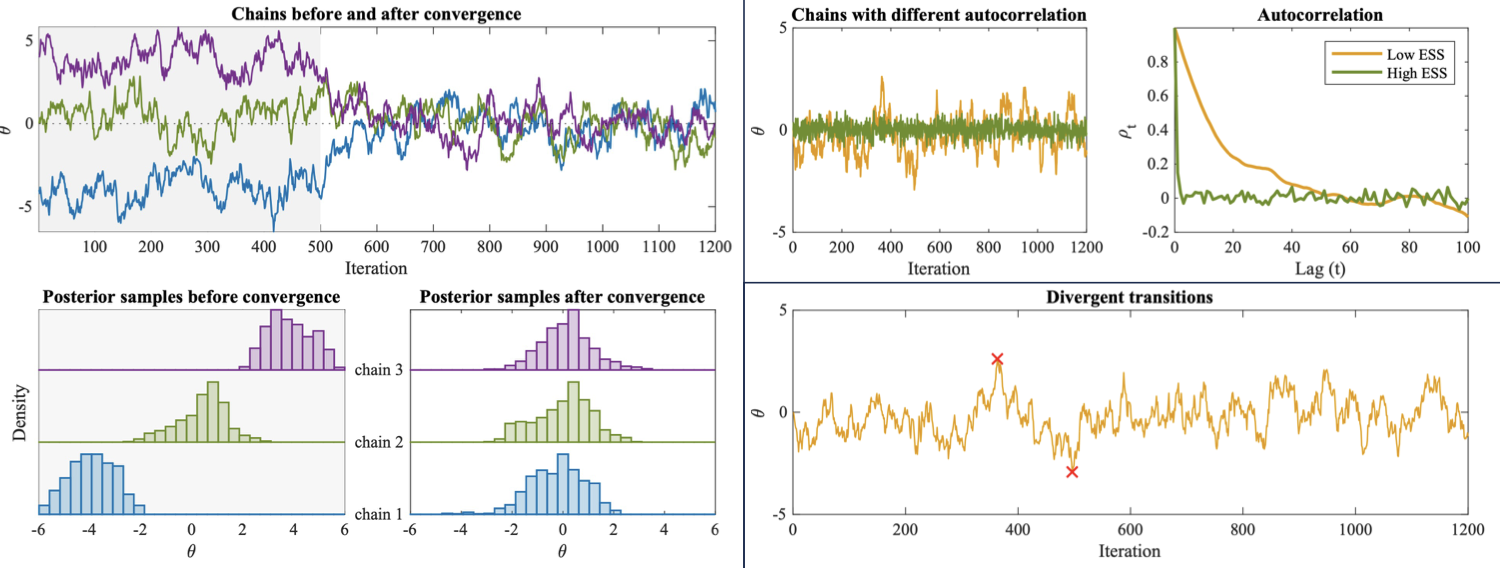
I rarely use Stan these days but I didn’t know it offers support for ODEs. This article is full of nice illustrations including the low-level machinery for Bayesian inference, like Markov chain-based sampler, the Metropolis–Hastings algorithm or Hamiltonian Monte Carlo. Stan coding is discussed page 13 ff., and several examples are provided after that, with code available on GitHub.
♪ The Wake • Rusted 20
D.W. Zimmerman (2004). A note on preliminary tests of equality of variances. British Journal of Mathematical and Statistical Psychology, 57(1): 173-181. ↩︎