Biplots
I thought it would be funny to relate how I came from a query about “biplot displays in lisp” to statistical computing in R, using Google.
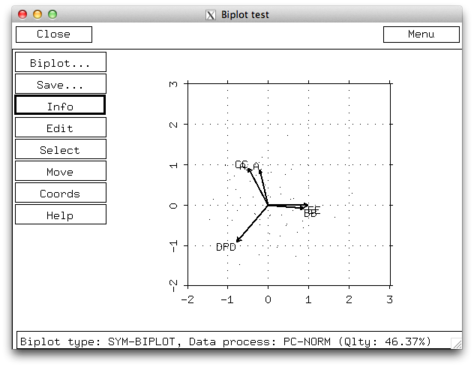
So, basically I was looking for existing implementation of biplots for Common Lisp. To be honest, I was suspecting that something would be available for xlispstat, and that was the very first hit: xls-biplot was written by Frederic Udina eight years ago. His paper published in the Journal of Statistical Software explains available transformations (functional transformation, weighting, centering) of the raw data and the way coordinates (standard, principal, canonical) can be computed to express variables relationships in a reduced factorial space. The picture below was taken when running the demo file in xlispstat ((test-bp)).
Leading to another, I came across the following paper: Weihs, C. and Schmidli, H. (1990). OMEGA (Online Multivariate Exploratory Graphical Analysis): Routine Searching for Structure. Statistical Science, 5(2), 175-208. See also a rejoinder by Forrest Young (author of Vista).
I’d like to add a note for myself here: I’ve learned there was a book on dynamic graphics written by Cleveland, Dynamic graphics for statistics (Wadsworth & Brooks, 1988), who also authored another book on Tukey’s work, The Collected Works of John W. Tukey: Graphics 1965-1985 (Chapman & Hall, 1988). About 10 minutes after I started browsing Google with cross-links from my initial query, I ended up with this thread on comp.lang.list, Is Xlisp-Stat Dead?, where Ross Ihaka describes his ongoing project on implementing a new R system, in Lisp (I initially thought that was Scheme that was retained). It looks like a closed loop: “From Scheme to R, and back to Lisp!”. Note that, one year ago, I dropped some notes on Lisp for statistical computing in Diving into Lisp for statistical computing.
- Ihaka, R. and Lang, D.T. (2008). Back to the Future: Lisp as a Base for a Statistical Computing System. CompStat'08.
- Ihaka, R. (2010). R: Lessons Learned, Directions for the Future. JSM'10.
- This thread on Christian Robert’s blog is also illuminating.
Back to biplots. I already talked about them on a related thread.
Biplots are really neglected topics in exploratory data analysis, and even more in explanatory data analysis. The French (and probably the Dutch) school uses them a lot as support for descriptive and explanatory analysis, but it’s hard to find published papers related to psychology, health research, or sociology that include a detailed account of the use of biplots or factor-related methods. I have some references on hand, like
- Viaux-Savelon, S. et al. (2010). Phenomenology, psychopathology, and short-term therapeutic outcome of 102 infants aged 0 to 12 months consecutively referred to a community-based 0 to 3 mental health clinic. Infant Mental Health Journal, 31(2), 242-253.
- Williams, L.J. et al. (2010). A tutorial on Multi-Block Discriminant Correspondence Analysis (MUDICA): A new method for analyzing discourse data from clinical populations. Journal of Speech, Language, and Hearing Research, 53, 1372-1393.
Good papers can also be found in journals related to ecology. (I mainly came across those papers by using the vegan R package, and reading some of Gavin Simpson’s good replies on r-sig-ecology mailing or his webpage.)
For R users, there’s the BiplotGUI package but it is for Windows only. A lot of packages for multivariate data analysis and factor-related methods have been released in the past few years. Here are the ones I know: ade4, ca, anacor, vegan, FactoMineR. I often use the latter because it reminds me of earlier courses I’ve taken in data analysis à la française. The authors published a nice textbook on Exploratory Multivariate Analysis by Example using R (Chapman & Hall/CRC Press, 2011), that was reviewed in the JSS.
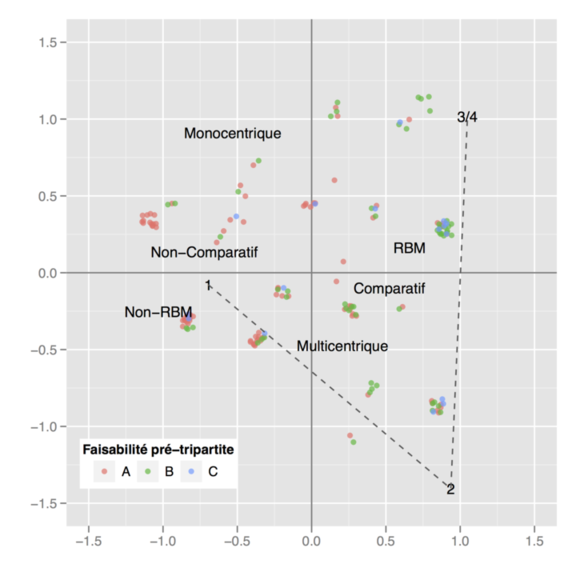
I started thinking of a ggplot2 implementation of biplot in R. At the time of this writing, it seems there was only one such attempt, namely ggbiplot,1 and it is limited to (SVD-based) PCA. I may fork the code at some point. The next picture is one of my experiences in translating FactoMineR biplot for multiple correspondence analysis using ggplot.
At this point, I should mention the definitive reference on this topic: Gower, J.C. and Hand, D.J. (1996). Biplots. Chapman & Hall:
Biplots are the multivariate analog of scatter plots, using multidimensional scaling to approximate the multivariate distribution of a sample in a few dimensions, to produce a graphical display. In addition, they superimpose the representations of the variables on this display, so that the relationships between the sample and the variables can be studied. Like scatter plots, biplots are useful for detecting patterns and for displaying the results found by more formal methods of analysis.
It is also worth citing other related books by Gower:
- Gower, J.C., Gardner-Lubbe, S., and Le Roux, N. (2007). Understanding biplots. Wiley-Blackwell
- Gower, J.C. and Dijksterhuis, G.B. (2004). Procrustes problems. Oxford University Press.
Here are some further papers on biplot construction and/or interpretation that were missing in my list of references:
- Gower, J.C. (2003). Unified biplot geometry, in Ferligoj, A. and Mrvar, A. (eds.), Developments in Applied Statistics. Ljubljana : Fakulteta za družbene vede.
- Vicente-Villardon, J.L., Galindo-Villardon, M.P., and Blazquez-Zaballos, A. (2008). Logistic biplots.
- Meulman, J. (1996). A distance-based biplot for multidimensional scaling of multivariate data.
- Aitchison, J. and Greenacre, M. (2002). Biplots of compositional data. Journal of the Royal Statistical Society: Series C, 51(4), 375-392.
Interestingly, the code has been made public following one of the author’s response on Cross Validated. ↩︎