Dealing with categorical variables in Mathematica
Until now, I was always defining a design matrix by hand to fit, say, a linear regression model with categorical covariates in Mathematica. If you know how to define a linear model in Mathematica, DesignMatrix works exactly the same. I suggested this approach to a Matlab user a long time ago. Then I realized that Mathematica provides NominalVariables since at least version 7. Of course, I was searching using different keywords (e.g., “categorical predictors” or “dummy coding” – the latter being used for dummy variables in a mathematical sense) all time long.
The take away message is that if you happen to work with a rectangular table where categorical predictors are stored using their labels rather than a numerical code, and you want to perform a one- or two-way ANOVA, or an analysis of covariance, then NominalVariables -> Automatic is your best friend.
As an illustrtaion, consider the following Stata dataset, polymorphism.dta,1 which includes 3 variables (participant ID, age, genotype with three levels). The magic of Import is that it works with Stata data format too, especially when it is imported as a Dataset:
d = Import["polymorphism.dta", "Dataset"];
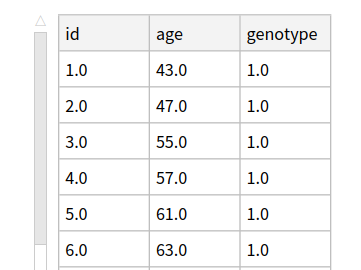
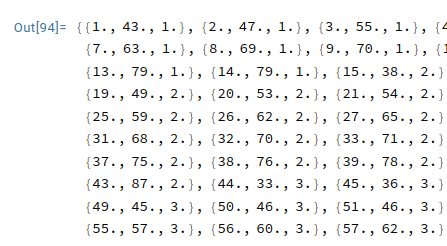
If you prefer the traditional Table view (right panel in the above figure), you can omit the last option, and if you really need to add a header, you can add it in the front of the list:2
labels = {"id", "age", "genotype"};
d = Prepend[Import["polymorphism.dta"], labels];
Note that you can also flatten your Dataset using ̀Flatten /@ List @@@ Normal @ d (h/t kglr. I much prefer working with lists than Dataset, but that may well be because I have had bad experiences with GroupBy and GatherBy on Datasets so far.
Back to model fitting. To change the reference category, say consider the third category as the baseline, I did not find an easier way than recoding the numerical values using an anonymous function like so:3
dd = MapAt[4 - #&, d, {All, 3}
Then we can fit a one-way ANOVA and print an ANOVA table using the following commands:
m = LinearModelFit[dd[[All, {3, 2}]], x, x, NominalVariables -> x];
Normal[m]
m["ANOVATable"]
Note that regressors come first, and the response variable is the last one (age is the second column in our case). If you have multiple explanatory variables, use a list instead, e.g. {x1, x1^2, x2}, {x1, x2}. It is also possible to let Mathematica build indicator variables for categorical variables using NominalVariables -> Automatic; it works well when categorical variables are stored as strings and not as integers in your Table.
♪ Jeff Beck Group • Situation
William D. Dupont (2009). Statistical Modeling for Biomedical Researchers (2nd ed.), Cambridge. ↩︎
You could also create a Dataset on the fly:
↩︎d = Import["polymorphism.dta"] MakeDataset[data_List, header_List] := Dataset[AssociationThread[header, #] & /@ data] MakeDataset[d, labels]Note that this is equivalent to defining a named function instead of using an anonymous function, e.g.
↩︎f[x_] = 4 - x MapAt[f, d, {All, 1}]