Debugging in Vim
I learned recently about Termdebug, which is built-in debugger for Vim and Neovim. Since I stopped using nvim-dap and MS debug adapter protocol, I’ve been using good old GDB for C, and print statements for Python. That’s fine. In the latter case, I also drop a breakpoint() instruction sometimes, and use pdb. Apparently, we can’t use pdb with Termdebug, but gdb and rust-gdb work just fine. For Haskell, this is slightly a different problem arising from unavailable debug symbols. However, ghci works also just fine since it comes with a bunch of debugging commands.
Here are the corresponding documentation: gdb, ghci, pdb.
Near the end of the day, I’ve succesfully configured Termdebug for C and Rust, as well as pdb and ghci for Python and Haskell. I defined some wommon mappings to launch the debugger in a split window, together with other utilities to make or launch an REPL. Also, inspired by Cheat40, I wrote a quick cheatsheet for the various commands available in each debugger. They are mostly comparable, especially between gdb and pdb, but Haskell’s ghci comes with additional settings like :set -fbreak-on-exception to log steps until an exception occurs.
A sample configuration for python is shown below:
augroup whitespace
  au BufWinEnter *.py let w:m2=matchadd('WarningMsg', '\%>80v.\+', -1)
  au BufWinLeave *.py call clearmatches()
augroup END

compiler pyunit
setlocal makeprg=python3\ %
setlocal errorformat=

setlocal foldmethod=indent
setlocal foldlevel=99

nmap <buffer> gs :10 split term://python3 %<cr>:startinsert<cr>
nmap <buffer> gS :10 split term://ipython --simple-prompt<cr>:startinsert<cr>
nmap <buffer> gK :!nvim-keywordprg python <cword><cr>
nmap <buffer> <localleader>dd :10 split term://python3 -m pdb '%:p'<cr>
nmap <buffer> <silent><localleader>? :<C-u>Cheatdebug<cr>

ia <buffer> pp print(f"DEBUG:")<Left><Left>
ia <buffer> bb breakpoint()<Esc>mb

highlight link myHighlight WarningMsg
match myHighlight /breakpoint()/
Note that I use Neovim built-in LSP to get hover information on symbol at point, but I also have a custom mapping to launch pydoc3, or even Dasht.
Unfortunately, setting a breakpoint in pdb or ghci will not highlight the corresponding line in the buffer, and of course Termdebug output is more rich than those simple shells. However, note that this setup does not require any additional dependecies beside gdb and rust-gdb. No complex setup to attach to a running process or to download various adapters (this always worked fine, though; it’s just that it is far more advanced than what I discuss here, for results that are close in both approaches).
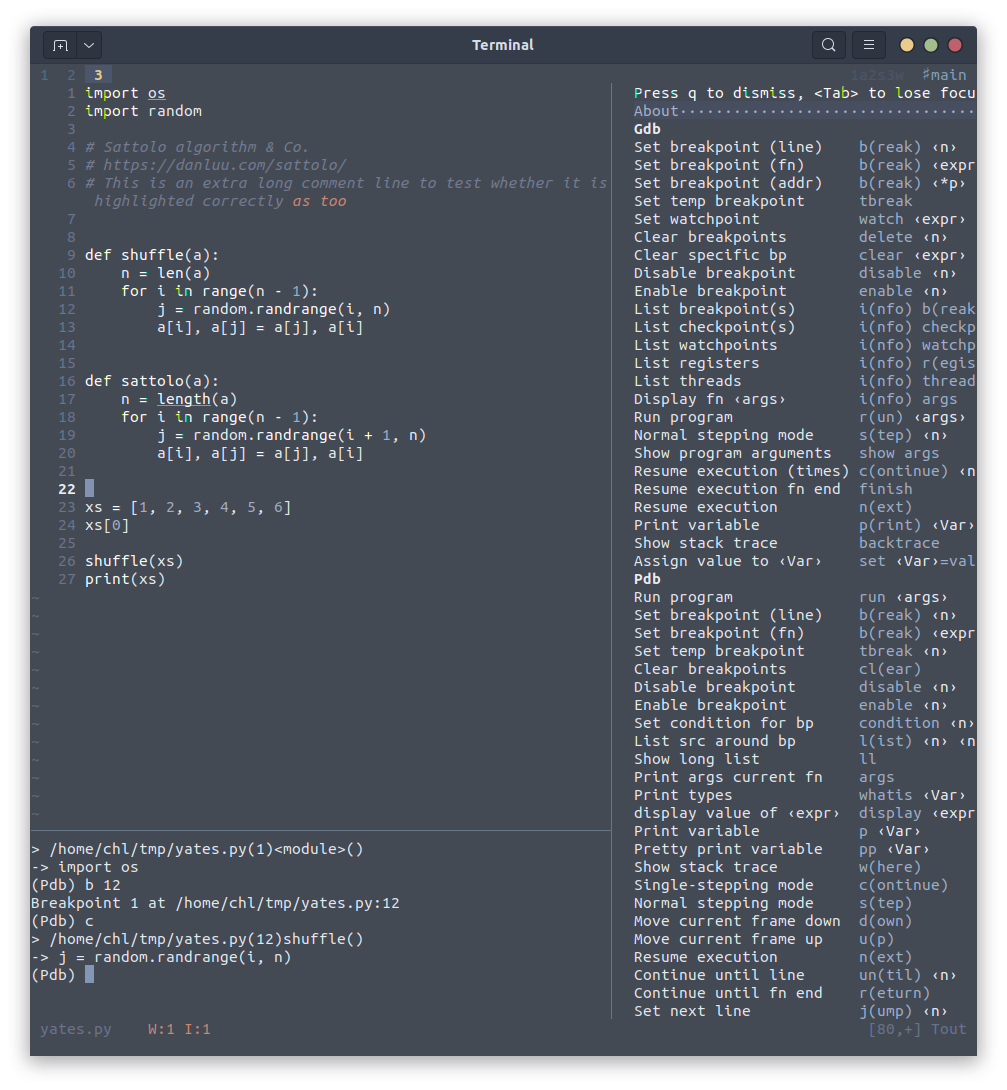
Here is a preview of a fake debugging session on a Python script:
♪ Queens of the Stone Age • Long Slow Goodbye