Book review: Mathematica
Here are my very first impressions on some of the books on Mathematica that I read recently.
Mathematica Data Analysis (Suchok, 2015)
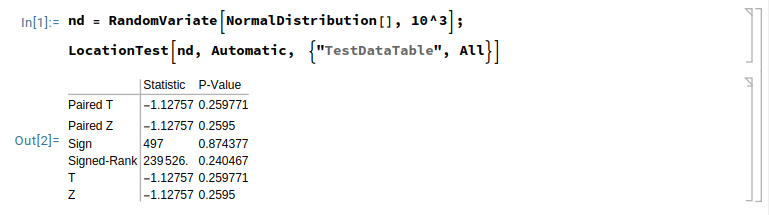
I did not really like this book1 but I did learn some useful trick for munging data using Mathematica. Note that when I say I did not like the book, it mostly has to do with like the structure of the book itself, and the shortcuts that the author took here and there. It is like the author assumes that the reader already know Mathematica higher-order functions or that /@ is a shorthand for Map, and there’s no logic about how data are processed. It looks like a series of recipes, and we don’t learn how to think “in Mathematica” to manage data. Furthermore, I found it lacks some structure: just after talking about image analysis (face recognition, or barcode analysis), we are (not so) deep inside time series analysis, and then this is all about classical inference and two-sample tests. I was a little bit worried when I read that for a single simulated series of values, the result table mentioned paired T or Z tests,2 as shown below (left), and I just stopped reading at this point.
Mathematica Data Visualization (Saquib, 2014)
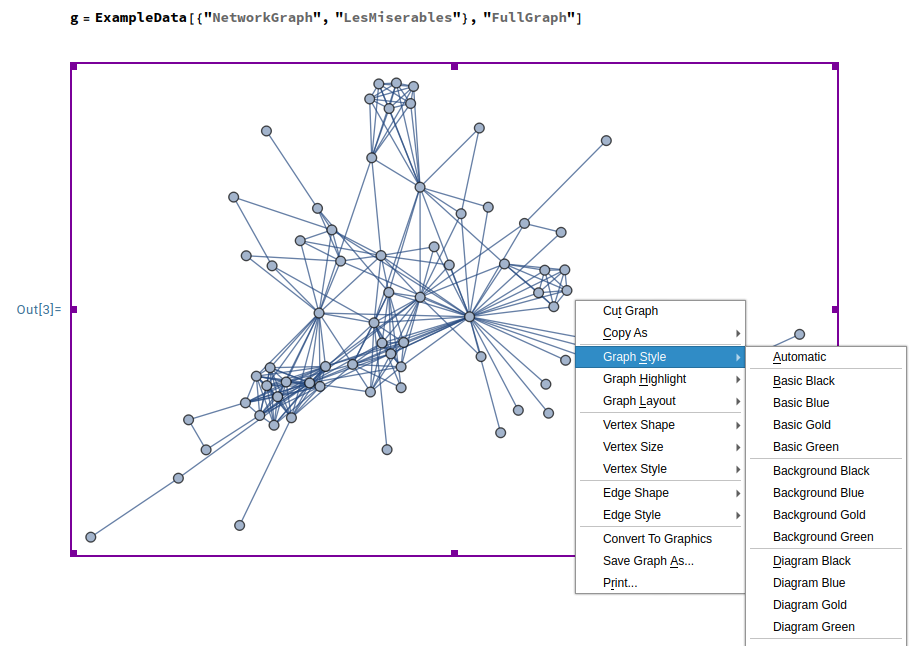
Same complaint here. Again, it assumes that the reader is already familiar with data munging in Mathematica, and the introductory second chapter only covers basic properties of lists and functions. Then, CSV data files are imported using the magic Import, and some illustrations using ListPLot are given together with information about customizing the resulting output. Chapter 3 deals with time series while chapter 4 introduces more elaborated charts (histograms, similarity maps, wordcloud, graph and chord diagrams). Together with the short discussion on high-dimensional data, these were the most interesting parts of the book. We should acknowledge the fact that Mathematica provides great defaults, especially for plotting and displaying data in a notebook. The image on the right in the above panel is an example taken from the book.
Mathematica by Example (Abell & Braselton, 2021)
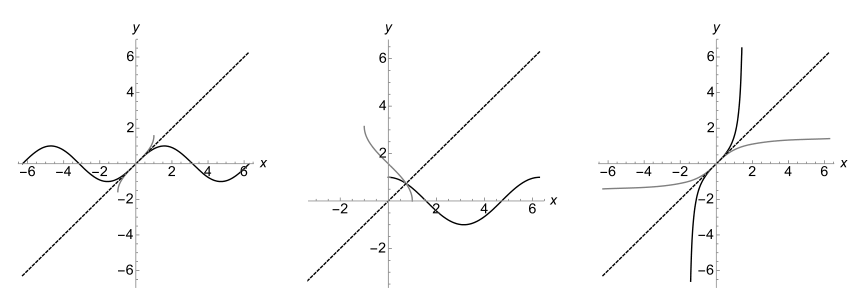
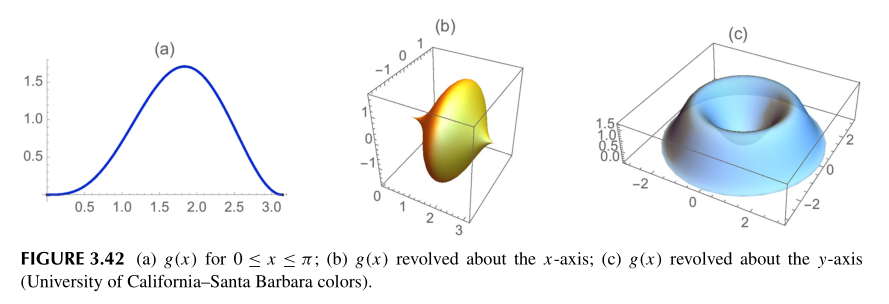
This is a book I would recommend for someone who wants to learn Mathematica to do applied mathematics. This is not a book about Mathematica programming per se, but how to get your job done using the many facets of Mathematica. Chapter 2 describes baisc operations on numbers, including rationales. The authors sometimes raise subtle issues regarding Mathematica’s rules for evaluating, e.g. Input or Traditional form like Sin[Pi/6]^2 versus Sin^2[Pi/6] (the latter is interpreted as the former only in TraditionalForm). Typesetting is not so great (a mix of mono and bold fonts, image or screenshots of running notebooks, or various mention of US universities for the choice of qualitative color palette,3 etc.), but it is not hard to follow. After you finish reading this chapter, you already know how to write and simplify simple mathematical expressions, define your own function and use Plot (including the Epilog option!). After Chapter 2, you should be able to represent graphically many mathematical expression surely. Chapter 2 deals with calculus, and it comes with very nice illustrations (Fig. 3.7 reminds me of one of my earlier post about the Newton-Raphson algorithm). It introduces the Manipulate command which brings dynamic and interactive visualization in Mathematica. I learned most of this stuff using a French textbook (Mathématiques pour les sciences de l’ingénieur avec Mathematica (tome 1), by Carmasol, 2013) but it was a great refresher.
In Mathematica, lists and tables are the core elements you often end up manipulating. Chapter 4 will help learn you more about that, and I learned a lot about that too. Chpaters 5 and 6 discuss more advanced math stuff.
♪ Killing Joke • Darkness Before Dawn
This pretty applies to most of Packt’s published stuff, with few exception regarding Python and Clojure. My impression is that over time the quality of published works has constantly deteriorated, like PLoS One in the scientific field: easy come, easy go, sure, but also the easier it is to publish, the less attention is paid to the competition. ↩︎
This somewhat reminded me of SAS who insists on displaying the results of non-parametric testing as well as normmality or equality-of-variance when you explicitly ask for a Student t-test. ↩︎
Apparently, the blue-dark yellow colorscheme is from the University of California-San Diego :-) ↩︎