Mathematica for statistics
I have long been interested in replacing R or Stata with Mathematica. I know it’s not entirely possible due to the large amount of dedicated statistical routines (especially, post-fit procedures) available in these two statistical packages, but Mathematica is fine for most use cases I encountered the last two years, i.e. fitting a linear regression to a bivariate datasets, fitting splines, computing pairwise correlation coefficient, working with contingency tables, etc.
Eralier on I wrote a quick tutorial on how to fit a simple logistic regression model with Mathematica. Anton Antonov has a nice blog which describes common tasks in statistics or machine learning, and plently of examples in his GitHub repository on R vs. Mathematica.
One of the nice feature of Mathematica is that the basic data structure for working with data is the list. Expressions like {{1, 0.8}, {2, 3.2}, ...} allows to construct a bivariate series, which can be manipulated using lot of built-in functions, and formatted accordingly in Matrix form or as a grid. Moreover, there’s now the Dataset structure, although it is not ready to be consumed by most statistical fitting routines I’m interested in. Anyway, using lists as the basis for higher-order data structures is really nice, especially when you’re already involved in the Python ecosystem. I like the following reply on HN:
Mathematica is an interesting case study for a general-purpose software package that happens to be more feature-full and functional – not just “more convenient” or “better UX” – than any open-source counterparts.
I tend to use some proprietary scientific software, but a lot of it is because academia already has already invested in codebases for, say, Stata, GAMS, Matlab and so on. But Matlab is two steps removed from raw Fortran; and what sets it apart from the many identical-syntax clones are a few narrowly-oriented toolsets aimed at some kinds of engineers.
Mathematica is the only one I buy versions for my home computer. It’s very, very good.
Same for me, except that I also have a paid license for Stata 13 MP.
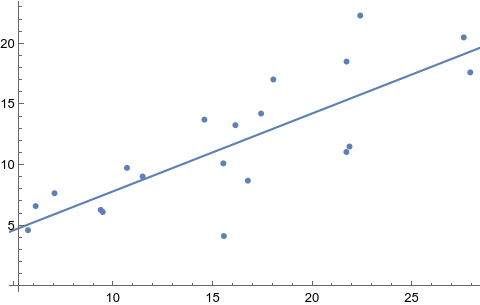
Here is a toy example of fitting a linear regression model in Mathematica:
data = Table[{3 + i + RandomReal[{-3, 7}], i + RandomReal[{-2, 5}]}, {i, 1, 20}];
Dataset[Prepend[data, {"x", "y"}]]

lm = LinearModelFit[data, x, x];
lm["BestFit"]

Show[ListPlot[data], Plot[lm[x], {x, 0, 30}]]
Even if this is a contrived example, it shows how easy it is to generate an artificial dataset, which can be printed much like an R data.table or Pandas data frame, to feed built-in functions. Most of Mathematica builtin functions are self-contained, which means there are a lot of optional parameters (but default values are usually good) and function names are generally well chosen. Default graphics are also well composed, as shown below:
One day, I will probably translate my old biostatistics tutorial to Mathematica.
♪ Lars Bygdén • Fall Into The Night