Fitting an OLS model in Newlisp
Yet a new post on Newlisp for statistical computing. This time we will try to fit a simple linear regression model using the GSL facilities offered by Newlisp modules. Unfortunately, the FFI bindings are rather sparse, and only a few linear algebra functions are implemented. Since the QR decomposition is available, we will use it, as we did in an another post. Recall that the vector of estimated parameters can be computed as $R^{-1}Q^Ty$, where $Rx = \bar y$, $y$ is rotated as $\bar y = Q^Ty$ and $R$ is triangular.
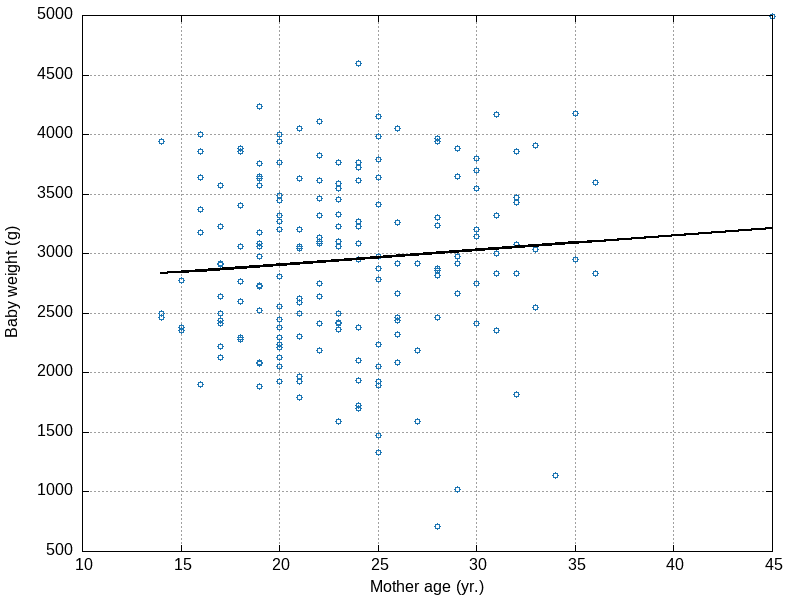
Same example as before (Hosmer & Lemeshow’s birth weight dataset), where we are interested in regressing the baby weights (g) onto mother’s age (years).
(module "gsl.lsp")

(define zip (lambda (x y) (map list x y)))

(set 'data (read-file "/home/chl/tmp/birthwt.csv"))
(replace "," data " " 0)
(set 'values (map int (parse data)))
(set 'x (rest (select values (sequence 1 (length values) 10))))
(set 'y (rest (select values (sequence 9 (- (length values) 1) 10))))
(set 'xs (zip (series 1 1 (length x)) x))

(gsl:QR-solve xs y)
;; => (2655,744469705172 12,4297120277146)
Great! Compare to the built-in function:
(module "stat.lsp")

(stat:regression x y)
;; => (2655,744469705173 12,42971202771453)

(set 'yhat (stat:fit x y))
(set 'out (zip (zip x y) yhat))
(write-file "/home/chl/tmp/lbw_fit.dat" (stat:list2ascii out))
At this point, I’m afraid there’s not much we can do to go forward since the stat module does not offer a way to build a regression or ANOVA table.
$ sed -i -e 's/(//g' -e 's/)//g' -e 's/,/./' lbw_fit.dat
$ gnuplot -p -e "set terminal png size 800, 600; set output '~/tmp/lbw_fit.png'; \
    set grid; set xlabel 'Mother age (yr.)'; set ylabel 'Baby weight (g)'; \
    plot 'lbw_fit.dat' u 1:2 w p pt 6 notitle, \
    'lbw_fit.dat' u 1:3 w l lc rgb 'black' lw 2 notitle"
By the way, Gnuplot itself is able to fit a linear regression from raw data. Finally, here are Stata’s results for reference:
. import delimited /home/chl/tmp/birthwt.csv
. regress bwt age

      Source |       SS       df       MS              Number of obs =     189
-------------+------------------------------           F(  1,   187) =    1.54
       Model |   815483.22     1   815483.22           Prob > F      =  0.2165
    Residual |  99154172.6   187  530236.217           R-squared     =  0.0082
-------------+------------------------------           Adj R-squared =  0.0029
       Total |  99969655.8   188  531753.488           Root MSE      =  728.17

------------------------------------------------------------------------------
         bwt |      Coef.   Std. Err.      t    P>|t|     [95% Conf. Interval]
-------------+----------------------------------------------------------------
         age |   12.42971   10.02278     1.24   0.216    -7.342539    32.20196
       _cons |   2655.744   238.8571    11.12   0.000     2184.544    3126.945
------------------------------------------------------------------------------
♪ Rebound • Sebadoh