Plotting with Newlisp
I installed newlisp manually, although I now realize there’s a deb package available for Ubuntu 22.04. Anyway, I was missing two files: guiserver.lsp and guiserver.jar. The Lisp file is easy to get from the modules page, and I just copied it to the right place (/usr/local/share/newlisp) but I found no indication on how to get the Java file. So I grabbed a copy of guiserver.jar from the guiserver.tgz tarball referenced on Links and Code Contributions, and it just works. Note that I also had to install libcanberra-gtk-module along the way, in order to remove a minor warning when issuing plotting commands.
The statitstics module only contains very basic stuff, but there’s also a gsl module which gives us more power. Unfortunately, it expects GSL library in /usr/local/lib, and not /usr/lib. I symlinked libgslcblas.so and libgsl.so into /usr/local/lib, and this solved the problem.
(load (append (env "NEWLISPDIR") "/modules/plot.lsp"))
(set 'data (read-file "birthwt.csv"))
(replace "," data " " 0)
(set 'values (map int (parse data)))
(set 'x (rest (select values (sequence 2 (length values) 10))))
(set 'y (rest (select values (sequence 9 (- (length values) 1) 10))))
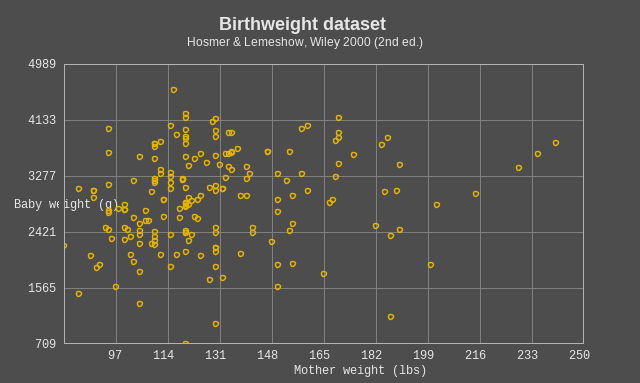
The x and y variable defined above represent the weight of the mother and of the baby, respectively. There might be a better way to mine those values from the tabular dataset, but contrary to xlispstat, newlisp isn’t really a col-major language. Anyway, we are ready to generate a basic scatterplot:
(set 'plot:title "Birthweight dataset")
(set 'plot:sub-title "Hosmer & Lemeshow, Wiley 2000 (2nd ed.)")
(set 'plot:unit-x "Mother weight (lbs)")
(set 'plot:unit-y "Baby weight (g)")
(plot:XY x y)
(plot:export "fig-bwt-newlisp.png")
That was quite easy, but I fear there’s not much plotting functions available except plot, which produces univariate line plot. I guess we will have to resort to Gnuplot or plotutils for more capabilities. However, let that not stop us investigate into this scripting language. In future posts, I expect to show how to fit basic linear models using GSL and to perform some data mining tasks.
♪ Ray Mantilla • Martinez