Manipulating images using Numpy
I always found that Python was great for manipulating strings, or even lists, which is why it remains my language of choice, as opposed to R, for bioinformatics stuff. Needless to say, I hate significant indentation, but other than that I find the language pleasant, and as they said it comes battery included. There’s lot to learn from the base module.
Today, I was trying to make some graphic with Matplotlib and I happened to find some interesting side-effects that we can produce using imshow() alone.
import matplotlib.pyplot as plt
import numpy as np
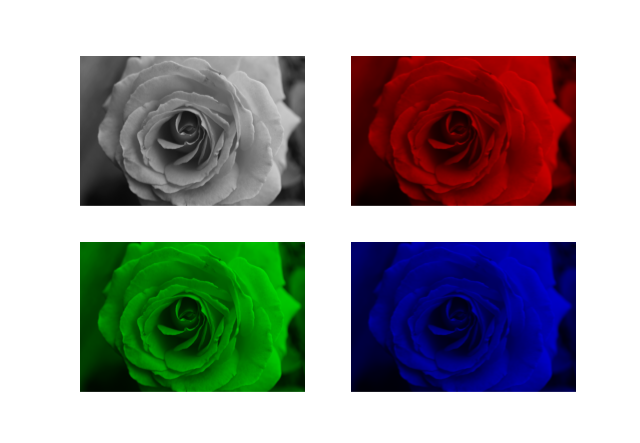
# Credit: https://www.publicdomainpictures.net/pictures/210000/velka/rose-grayscale.jpg
img = plt.imread("rose-grayscale.jpg")
idx = [[1,1,1], [1,0,0], [0,1,0], [0,0,1]]
for i in range(4):
plt.subplot(2, 2, i+1)
plt.imshow(img*idx[i])
plt.axis('off')
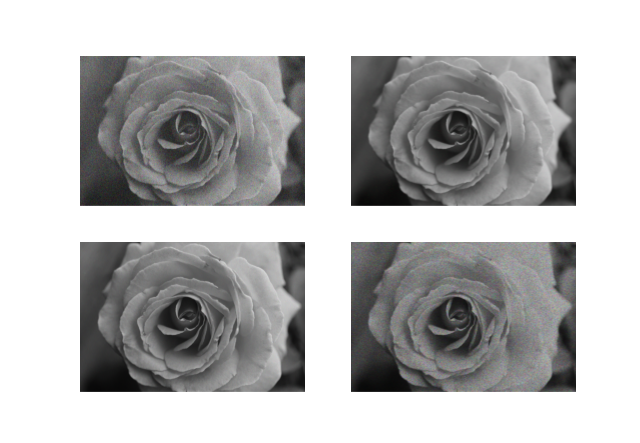
Other manipulating RGB channels using simple matrix operations, we can also use more advanced techniques like adding blur or low-pass filter effects with OpenCV2. However, using Numpy alone we can also add some salt and pepper-like effect: (Credit: Shubham Pachori)
def noisy(noise_typ, image):
    if noise_typ == "gauss":
        row, col, ch = image.shape
        mean = 0
        var = 0.1
        sigma = var**0.5
        gauss = np.random.normal(mean, sigma, (row, col, ch))
        gauss = gauss.reshape(row, col, ch)
        noisy = image + gauss
        return noisy
    elif noise_typ == "s&p":
        row, col, ch = image.shape
        s_vs_p = 0.5
        amount = 0.004
        out = np.copy(image)
        num_salt = np.ceil(amount * image.size * s_vs_p)
        coords = [np.random.randint(0, i - 1, int(num_salt)) for i in image.shape]
        out[coords] = 1
        num_pepper = np.ceil(amount * image.size * (1.0 - s_vs_p))
        coords = [np.random.randint(0, i - 1, int(num_pepper)) for i in image.shape]
        out[coords] = 0
        return out
    elif noise_typ == "poisson":
        vals = len(np.unique(image))
        vals = 2 ** np.ceil(np.log2(vals))
        noisy = np.random.poisson(image * vals) / float(vals)
        return noisy
    elif noise_typ == "speckle":
        row, col, ch = image.shape
        gauss = np.random.randn(row, col, ch)
        gauss = gauss.reshape(row, col, ch)
        noisy = image + image * gauss
        return noisy

type = ["gauss", "s&p", "poisson", "speckle"]
for i in range(4):
    plt.subplot(2, 2, i+1)
    plt.imshow(noisy(type[i], img/255))
    plt.axis('off')
♪ Magazine • Back to Nature