Playing with BackupMyTweets
Lastly, I gave a try to backupmytweets to get an archive of my Twitter account.
Everything went fine, and my tweets were available after a few days. What is annoying, however, is that I cannot download the data. I tried several times during the last two weeks, and I always end up with an error message.
So, I decided to save the raw HTML page and then process it manually. This was done using a Perl script, tweets_html2txt.pl.1 Basically, it does the following: read in the HTML file, extract the content included between <li> tags, and output the date and text of each tweet. I can then process these data with R (although I could have manage to do this with perl too).
Here is a sample of the raw text file (tweets.txt) that I am currently working on:
2009-07-12 \ In Copenhagen, for the DSC2009 conference
2009-07-08 \ Is attending the UseR 2009 conference in Rennes
2009-03-25 \ Attending the 3rd Workshop on Genomic Epidemiology ...
I was initially thinking of processing these data with R. But, now that I have a clean text file, I can use un*x command-line utilities to get some rough measures of my Twitter activity:
$ cat tweets.txt | grep 'Retweet' | wc -l
$ cat tweets.txt | grep -o -E '#[A-Za-z0-9]+' | uniq -c \
  | sort -r | head -n 5
$ cat tweets.txt | grep -o -E --color=never '[0-9]{4}-[0-9]{2}-[0-9]{2}' \
  | uniq -c | sort -k 2
The first command gives me the number of retweets, and the second list the frequency of the top five hash tags. The last command filter the number of tweets by date (in chronological order). The last one can be directly piped to the graph utility from the plotutils package. However, the data looks like this:
1 2009-03-25
1 2009-06-21
2 2009-07-08
and we need to have data formatted as (x,y) pairs arranged by columns; this means that I need either to add line numbers to the result (and ignore the third column of date) or to swap the columns returned by the third command; in both cases, I also need to remove color, otherwise shell escape formatting characters will be printed int he results file. The first solution is roughly obtained with, e.g.:
$ !! | nl | cut -c 1-11 > tweets_by_date.dat
$ graph -T ps -F HersheySans -f 0.035 -S 2 0.025 -m 0 -X Time -Y Frequency \
  < xs_by_date.dat > plot.ps
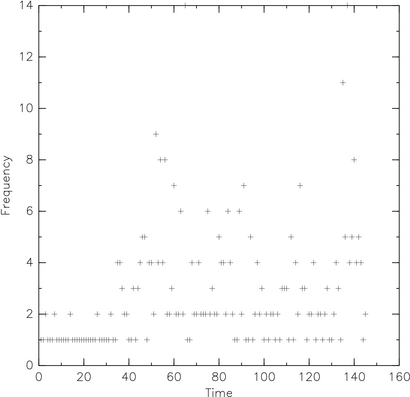
Yep, we are far from a ggplot2 picture.
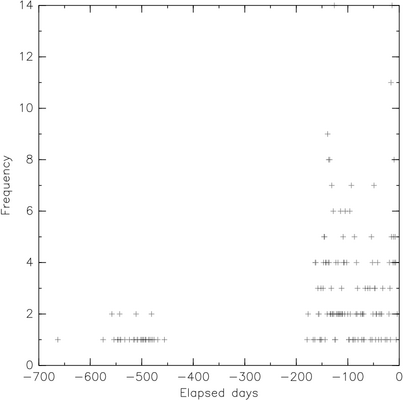
Moreover, this is not very informative since it lacks the time information. As a little exercise, the dates were converted to number of days elapsed since actual date. For this to be possible, date recorded as strings were converted to Julian dates, since it allows to express them as a single number (useful for computing differences between two dates). In our cases, we will consider Julian day which is the integer part of the Julian date. We also need to put date in the first column instead of the second. This is easily done by adding an awk filter, like this awk '{printf( "%s %d\n", $2, $1)}'. However, it is still possible to swap the x and y columns by using --toggle-transpose-axes.
The bash script that handles date conversion is called tojulian.sh. An example of use is:
$ start=`./tojulian.sh 2010-03-12`
$ stop=`./tojulian.sh 2011-01-16`
$ echo $stop-$start | bc -l
So, we can pipe our preprocessing steps to the following awk call:
awk '{printf( "%d %d\n", system("sh tojulian.sh " $2), $1)}'
or if we want the number of days from now (Julian day for 2011-01-14 is 2455576), we can use tojulian2.sh which includes minor edits in its output. Its use is straightforward:
$ tojulian2.sh 2011-01-14
0
$ tojulian2.sh 2010-01-14
365
However, this won’t work as expected because system() will return its exit status (0 if success) just after $2. A small workaround is to do:
$ cat tweets_by_date.dat | awk '{cmd="tojulian2.sh " $2; cmd \
 | getline dd; close(cmd); printf("%d %d\n", dd, $1)}' \
 > tweets_by_date2.dat
Ok, now the text file looks like
663 1
575 1
558 2
To use graph with these dates, we need to reverse the x-axis so that older dates have smaller abscissae. As I didn’t found any option in graph, I just negate the preceding values. It is enough to replace printf("%d %d\n", dd, $1)} by printf("-%d %d\n", dd, $1)} when calling awk.
$ graph -T ps -F HersheySans -f 0.035 -S 2 0.025 -m 0 -X "Elapsed days" \
  -Y Frequency < xs_by_date2.dat > plot.ps
Of course, all of the graphical stuff might have been obtained with Gnuplot.
I have been mainly focusing on the treatment of dates; obviously, the next step is to process the text data (i.e., text mining). In the meantime, here is a preview of my tweets as a worddle.

In conclusion, we have seen how with elementary commands, and using at most 10 built-in utilities (perl, bash, awk, grep, cut, uniq, sort, cat, nl, bc) plus graph, we have access to simple but efficient reporting facilities. No need to use external statistical software for that! Everything is available at the shell prompt. Now, I agree that Python + matplotlib or R + ggplot2 would produce far better results, at the price of few supplementary line of code. In fact, everything could have been done directly in Perl.
It should evolve to enable custom output like date + tweet or tweet alone, e.g.,
./tweets_html2txt.pl tweets.html -t 2 -o tweets.txt. The-tswitch will stand for1 = text only,2 = date + text. If no output file is provided, results are printed on the Terminal. Seetweets_html2txt.pl -hortweets_html2txt.pl --helpfor more information. ↩︎