Practical psychiatric epidemiology
I just read Practical Psychiatric Epidemiology, from Prince, M., Stewart, R., Ford, T., and Hotopf, M. (Eds.) (Oxford, 2003).
There is already a review in The British Journal of Psychiatry, 186: 268 (2005). Hereafter, I would like to quote some of the main ideas of this nice textbook on research and methodological aspects of psychiatric epidemiology. Although this textbook is mostly dedicated to students in epidemiology or psychiatry (which I am not, of course), it contains a huge amount of useful references and advices to whom may be concerned with the analysis of comparative studies in the biomedical domain. The growing interest in genetic-related studies and the now available statistical methods to deal with large-scale surveys or quality of life studies allow for a deeper understanding and takings of mental health problems. These emerging issues in psychiatric epidemiology offer a new research area open to inter-disciplinary collaboration.
Basically, psychiatric epidemiology is concerned with the study of prognosis and treatment of psychiatric disorders. Contrary to more classical epidemiology, study on mental health related pathology does not always involve biological events or signals, thus emphasizing the need to build questionnaire or dedicated interview that might lead to some useable manifest variables. With this in mind, some of this work has more to do with usual psychometrics (i.e. the science of the measurement of mental phenomena). Generally speaking, work related to health care aims at answering three kind of question:
- What is going on? Only history taking, examination and diagnosis allow the practician to deal with such a question.
- Why? Answer to this question may be provided by etiological research based on transversal or longitudinal studies.
- What do we do about it? Answer to this question relies on intervention studies, including RCTs, but is obviously associated with some ethical problems.
These topics are treated at length in Section 2 of the textbook, which we will resume in a few paragraphs. Further, quoting Eaton (1986) cited on page 5:
Epidemiology is a branch of medicine, and thus the assumptions of the medical model of disease are implicit. The most important assumption is that the disease under study actually exists … In psychiatry this assumption is assuredly more tenuous than in other areas of medicine, because psychiatric diseases tend to be defined by failure to locate a physical cause (…)
This is just to say that psychiatric epidemiology has to be distinguished from classical epidemiological in the way data can be collected and inference may be drawn. Indeed, it is not very easy to design a study where we deliberately manipulate risk factors, nor when we decide to continue a study that would affect someone’s welfare. Thus, studies are mainly of observational nature per se, and there we run into problems related to confounding or mediating effects that are often not easily solvable.
Section 1 is mainly devoted to the history of psychiatric epidemiology and the new tools developed so far. Most of these statistical apparatus grow on measurement theory which put emphasis on validity and reliability of the measurement of mental processes. Such topics are dealt at length by G. Dunn in his textbook Statistics in Psychiatry. Additionally, case-control and cohort studies have provided much more interesting results than cross-sectional surveys developed in the eighteen century. These kind of study design are discussed in the next section, but see below. Cross-cultural issues are discussed in a separate chapter: V. Patel mainly points to the comparability of psychiatric disorders measurement in different countries whose social and cultural setting may interfere with a direct and clear-cut interpretation of the results.
Section 2 reviews the basic experimental design used to assess or uncover significant marker of mental disorders. As shown in the next figure, this includes: cross-sectional, case-control and cohort or longitudinal studies, randomized clinical trials, and post-hoc or meta-analysis. In short, the design and analysis of a study aims at maximizing the precision and validity of its findings. Avoiding bias or confounding effect is thus the primary goal of any epidemiologist, especially because most of the studies under consideration are observational per se. Strict control over experimental factors or exposure, like in an RCT, are thus generally lacking.
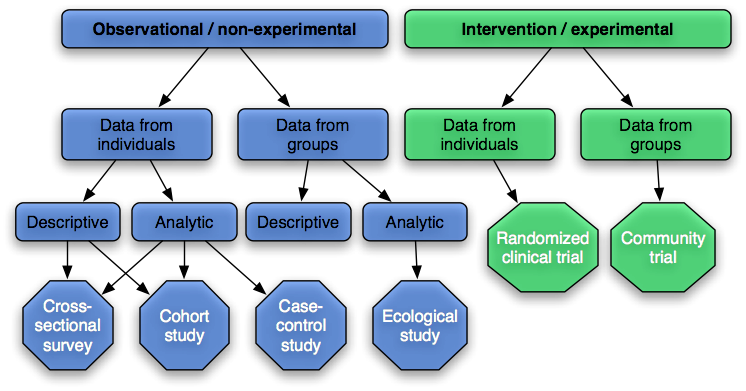
Here are the main advantages and drawbacks of each design:
- Ecological studies: possible “ecological fallacy” effect.
- Cross-sectional surveys: no direct evidence of causality, representative sampling frame, response rate, not applicable to rare disorders.
- Case-control study: mainly retrospective, subjects defined by outcome, can handle multiple exposures, odds-ratio approximately equal to relative risk in a cohort study for rare disorders (prevalence < 10%), prone to several form of bias (selection, information, i.e. observer and recall).
- Cohort study: longitudinal (prospective) design or historical cohort or population cohort, subjects designed by their exposure, not well-suited for rare disorders, can handle multiple outcomes/exposures, no information bias.
- Intervention study: allocating exposure to subjects and comparing the outcome of interest in different random groups, no information bias provided trials are double-blind.
I also reproduce Table 5.1 (page 87) as it summarizes much of the characteristics of each study design.
| Cross-sectional survey | Case-control | Cohort | Ecological | Clinical trial | |
|---|---|---|---|---|---|
| Subject selection | Defined population | Caseness | Exposure | Aggregated data | Caseness |
| Source of bias | Selection, Non-response, Information (Recall and observer | Selection, Information (Recall and observer) | Information (observer only), Loss to follow up (selection) | Selection of population, Ecological fallacy | Selection, Information (reduced by blinding) |
| Probability of confounding | Medium | Medium | Low | High | Very low if randomized |
| Resources | Quick and cheap | Relatively quick and cheap | Lengthy and expensive | Relatively quick and cheap | Relatively expensive |
| Applications | Planning services, Mapping secular and geographical trends, Identifying correlates | Rare outcomes, Single outcomes, Multiple exposures | Rare exposure, Single exposures, Multiple outcomes | Rare outcomes, Rare exposures, Multiple exposures, Population exposures such as air pollution | Efficacy of new interventions, Effectiveness of new interventions, Hypothesis testing, Mechanisms |
| Measures of effect | Prevalence | Odds ratio | Relative risk | Correlation/regression coefficient | Relative risk/odds ratio/difference between means |
Probably the most well-known designs are the Case-control and Cohort design study. Case-control studies are most appropriate when the disorder under study is (i) rare, (ii) takes a long time to develop after the exposure (sometimes referred to as the latent period), and (iii) where the exposure is common. Cohort studies are more appropriate when the disorder is (i) common, (ii) it does not take long to develop, and (iii) the exposure is rare. They both come with their own drawbacks and interpreting the results gathered through such approaches often involves a careful inspection of the hypothetical causal pathways.
In either case, we need to ensure the proper recording of the data, as well as appropriate statistical analysis. While the former may be facilitate with dedicated software1, care must be taken when analyzing data gathered through complex sampling frame, like stratified sampling with unequal sampling weights or cluster sampling. Such designs call for specialized software like SAS or Stata, though SPSS now has some survey design capabilities (since version 15). S.J. Pocock gives a nice overview of clinical trials and how to manage them: When to stop a clinical trial.
Section 3 puts emphasis on the reading of data, in particular on the relevance of causality in the interpretation of a significant association between symptoms, biological or genetical markers, and disturbed behavior or mental trouble. This is probably the most interesting aspect of such studies, and obviously the harder one… Many software are available for study comparison, also known as meta-analysis (e.g. Revman), but read the chapter Software for meta-analysis and publications bias of Publication Bias in Meta-Analysis: Prevention, Assessment and Adjustments, H. Rothstein, A.J. Sutton, and M. Borenstein (Wiley, 2005). There is also this interesting article in JAMA, Meta-analysis of Observational Studies in Epidemiology, and BMJ, Investigating and dealing with publication and other biases in meta-analysis, written by J.A.C. Sterne and coll. Both are available on-line.
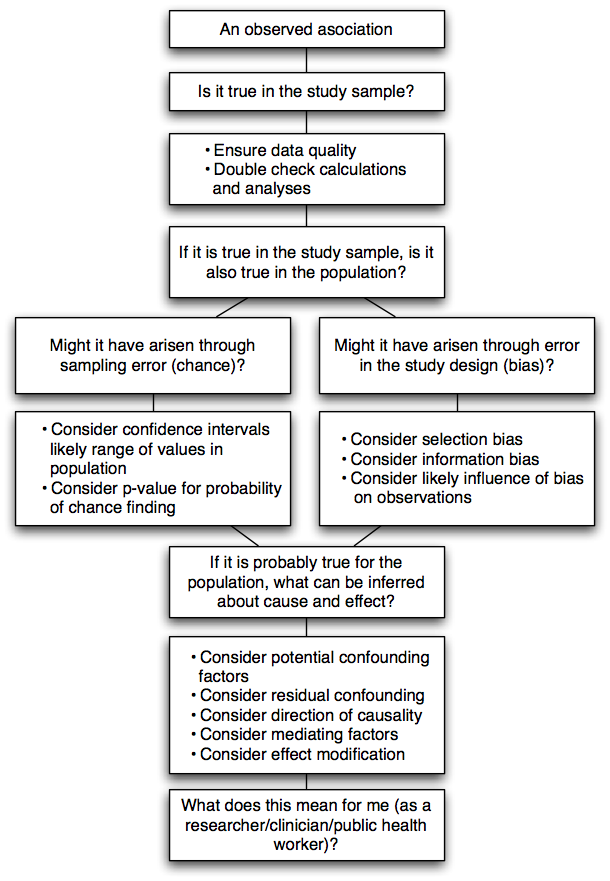
The fundamental question when interpreting research findings is to consider what observations “mean” and what can be inferred from them. The CONSORT statement also provides useful guidelines for reporting results gained through RCTs. The diagram below illustrates the checking process that every critical reviewer may follow in order to ensure that a correct inference can be done based on the observed results.
Robert Stewart offers in Chapter 13 an extensive discussion around causal pathways and how inferential aspects shall be handled. The following table summarizes the approach promulgated by Hill (1965) which includes 9 different criteria related to causation effect. His original article was indeed entitled The environment and disease: association or causation?.

Causation, or causality interpretation, are by far the most difficult aspects of epidemiological research. Cohort and cross-sectional studies might both lead to confounding effects for example. Another set of criteria has been proposed by H.B. Asher in Causal Modeling (Sage, 1976), as cited by S. Menard (Longitudinal Research, Sage University Paper 76, 1991):
- The phenomena or variables in question must covary, as indicated for example by differences between experimental and control groups or by nonzero correlation between the two variables.
- The relationship must not be attributable to any other variable or set of variables, i.e., it must not be spurious, but must persist even when other variables are controlled, as indicated for example by successful randomization in an experimental design (no difference between experimental and control groups prior to treatment) or by a nonzero partial correlation between two variables with other variable held constant.
- The supposed cause must precede or be simultaneous with the supposed effect in time, as indicated by the change in the cause occurring no later than the associated change in the effect.
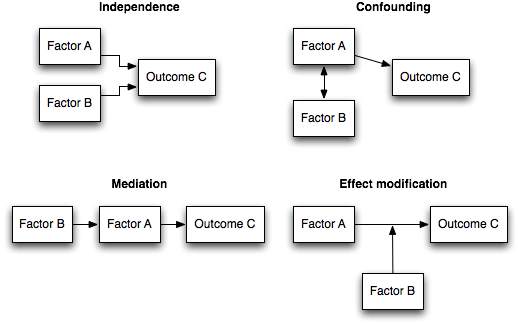
While the first two criteria can easily be checked using a cross-sectional or time-ordered cross-sectional study, the latter can only be assessed with longitudinal data, except for biological or genetic characteristics for which temporal order can be assume without longitudinal data. Of course, the situation becomes more complex in case of a non-recursive causal relationship. To catch up some of the most useful concepts, here is a brief illustration of the main cause-effect relationships one may encounter in an observational study:
The interested reader could also refer to Chapter 2 of Rothman’s Modern Epidemiology (1998, Lippincott Williams & Wilkins, 2nd Edition).2
Finally, Section 4 covers additional topics, not usually found in more classical textbooks, such as genetic epidemiology, health economics or qualitative research. In another post, I already talked about social epidemiology which is a more recent methodological approach in epidemiology.
Additional links
Here are some useful links about actual survey or health related information systems, as well as various links related to medical statistics:
- The European Health Survey System
- OCDE Santé
- Medical algorithms
- Publications Bias
- CONSORT, Transparent Reporting of Trials
Finally, I have compiled some of the most relevant bibliography entries (to my opinion, of course) in the following HTMLized BibTeX file BibTeX file, or just get the source PEP.bib.
Remark
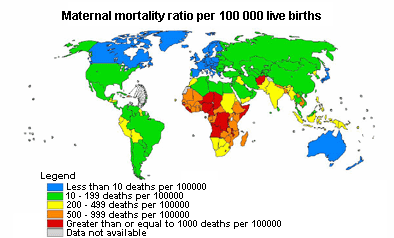
When I am looking for some large-scale (aggregated or not) dataset, I usually search the Eurostat database which contains data collected for the European Commission. In the case of biomedical data, a useful resources is the World Health Organization. For instance, the Global Health Atlas includes standardized data and statistics for infectious diseases at country, regional, and global levels. The figure below is taken from their homepage.
Notes
EpiInfo is a free package that can handle many of the usual statistical routines. It also includes a data editor which allows for double data entry comparison. Further, it can handle map files (ArcView compatible) and get data stored in a SQL database.
↩︎Now in its 3rd Edition, 2008! ↩︎