How to get scientific Python on Mac OS X Leopard
I was happy to be able to run all of the greatest of Python’s package for numerical stuff before I moved on Leopard. Since I reinstalled all of my system, I didn’t try to reinstall Python’s packages with the built-in Python (2.5). While I was reading some posts on the web, I feel a little bit desperate about the installation failures that were reported for those using the 2.5 Framework.
Note that numpy is already installed with Python 2.5, which is quite good. However, I’m interested in getting scipy, matplotlib and pygame working on Leopard, as they do previously on Mac OS X 10.4. Finally, I take the shorter route and install all using source packages, and all went fine. Now, Python works out of the box.
Installing SciPy
I used the SciPy Superpack which provides the core packages: NumPy, SciPy, Matplotlib, iPython and PyMC. The installer also contains a GFortran compiler.
Note that after the installation, you have to launch a new shell session to allow for path update. Otherwise, Python won’t find the new packages. To test, just enter in the shell:
>>> from scipy import *
If you don’t see any message like the following one, then it should be ok:
from scipy import * Traceback (most recent call last):
Installing Pygame
For a working pygame installation, I just follow the instructions here:
MacCompile on pygame website. You have to solve several dependencies
before building the pygame package, but this is just a 20 min. compilation
stuff.
To test the installation, just go in the examples directory (in the downloaded
archive), and test the stars.py and sound.py examples. You should get
something like that:
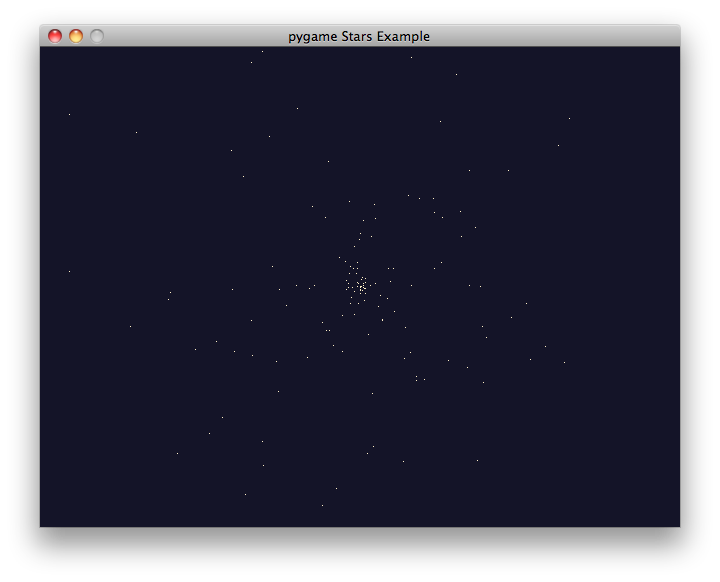
$ python stars.py
2008-07-02 09:56:19.408 Python[9025:613] Warning once: This application,
or a library it uses, is using NSQuickDrawView, which has been deprecated.
Apps should cease use of QuickDraw and move to Quartz
$ python sound.py
Playing Sound...
  ...still going...
  ...still going...
  ...still going...
  ...still going...
...Finished
with stars.py opening a window like the one below (and moving stars inside,
but I cannot capture them in a snapshot :-).
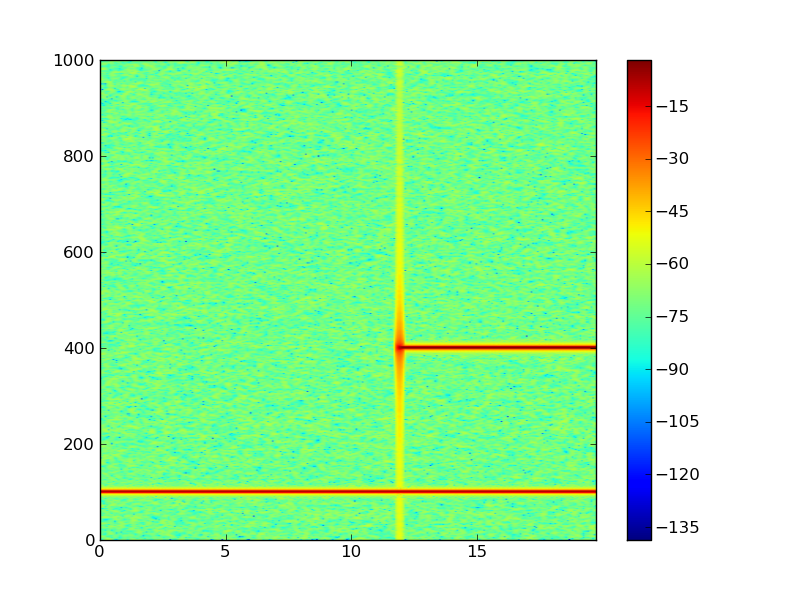
Now, what’s up? There are plenty of examples on how to use NumPy and SciPy, as well as Matplolib. For instance, the following snippet (specgram.py)
#!/usr/bin/env python
from pylab import *

dt = 0.0005
t = arange(0.0, 20.0, dt)
s1 = sin(2*pi*100*t)
s2 = 2*sin(2*pi*400*t)

# create a transient "chirp"
mask = where(logical_and(t>10, t>12), 1.0, 0.0)
s2 = s2 * mask

# add some noise into the mix
nse = 0.01*randn(len(t))

x = s1 + s2 + nse # the signal
NFFT = 1024       # the length of the windowing segments
Fs = int(1.0/dt)  # the sampling frequency
Pxx, freqs, bins, im = specgram(x, NFFT=NFFT, Fs=Fs, noverlap=900)
colorbar()

show()
shows a spectrogram in an interactive graphical device (see below).
For further readings, I would recommend:
- Langtangen, H.P. (2008). Python Scripting for Computational Science (3rd Ed.). Springer. (See online complements)
- Kinser, J. (2008). Python for Bioinformatics. Jones and Bartlett.