20 years with R: A retrospective
I gave my first statistics lecture using R almost 20 years ago. At that time, I mostly working on behavioral data and R appeared as nice replacement for Statistica or SPSS. At that time, Octave was not as good a pretender to MATLAB as it is nowadays, and Python’s data stack has not even started. Old times good times. That was really exciting to dive into a new programming languages dedicated to applied statistics, with a dedicated graphical device, a vibrant community of senior statisticians, and a central repository of packages modeled after CTAN and CPAN.
However, I lately became tired of all the new ways of doing R these days, and how the intrusion of modern packages impact at various degree the way I liked to do things in R. Although R has gained some popularity thanks to those packages, the whole ecosystem has been impacted, IMHO. I noticed there are now some hot debate between proponents of base R and those who prefer the tidyverse, much like the old R vs. Python flame that emerged 5 to 10 years ago. It’s probably time to stop worrying about all those things since I rarely need R these days, after all. But something is going on, for sure.
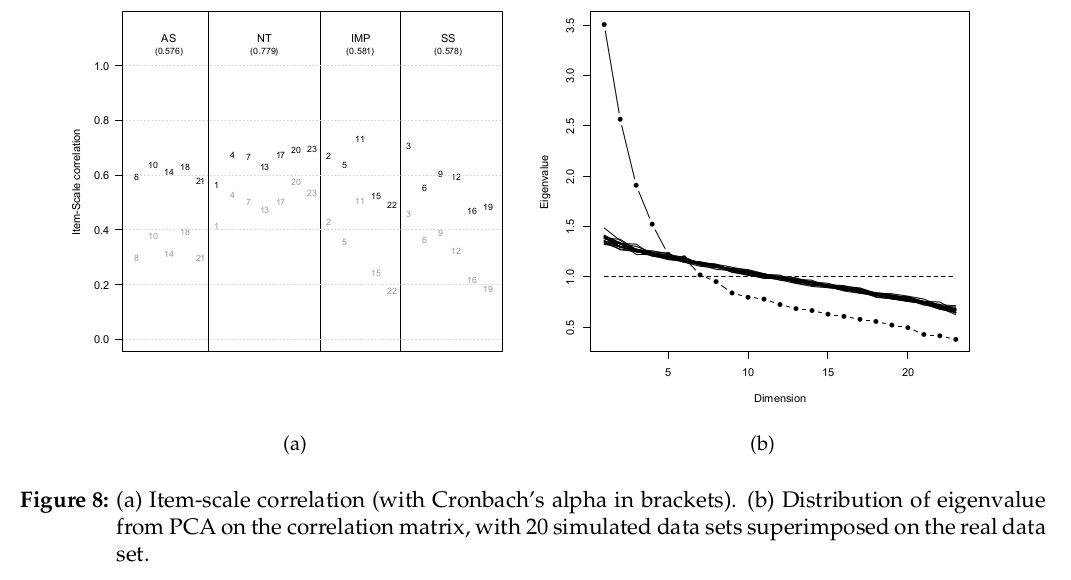
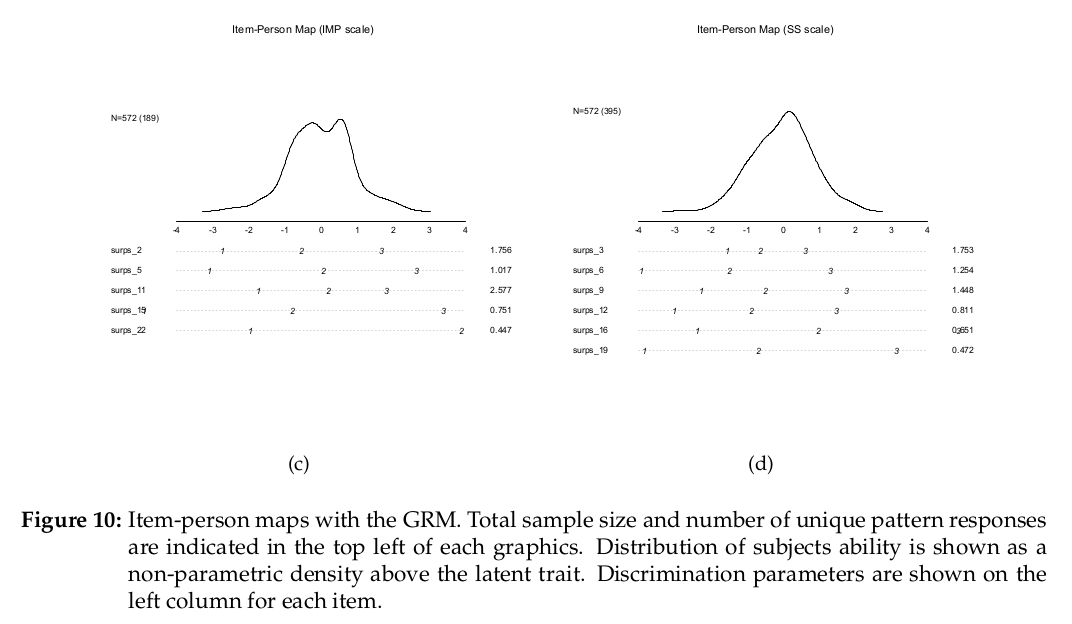
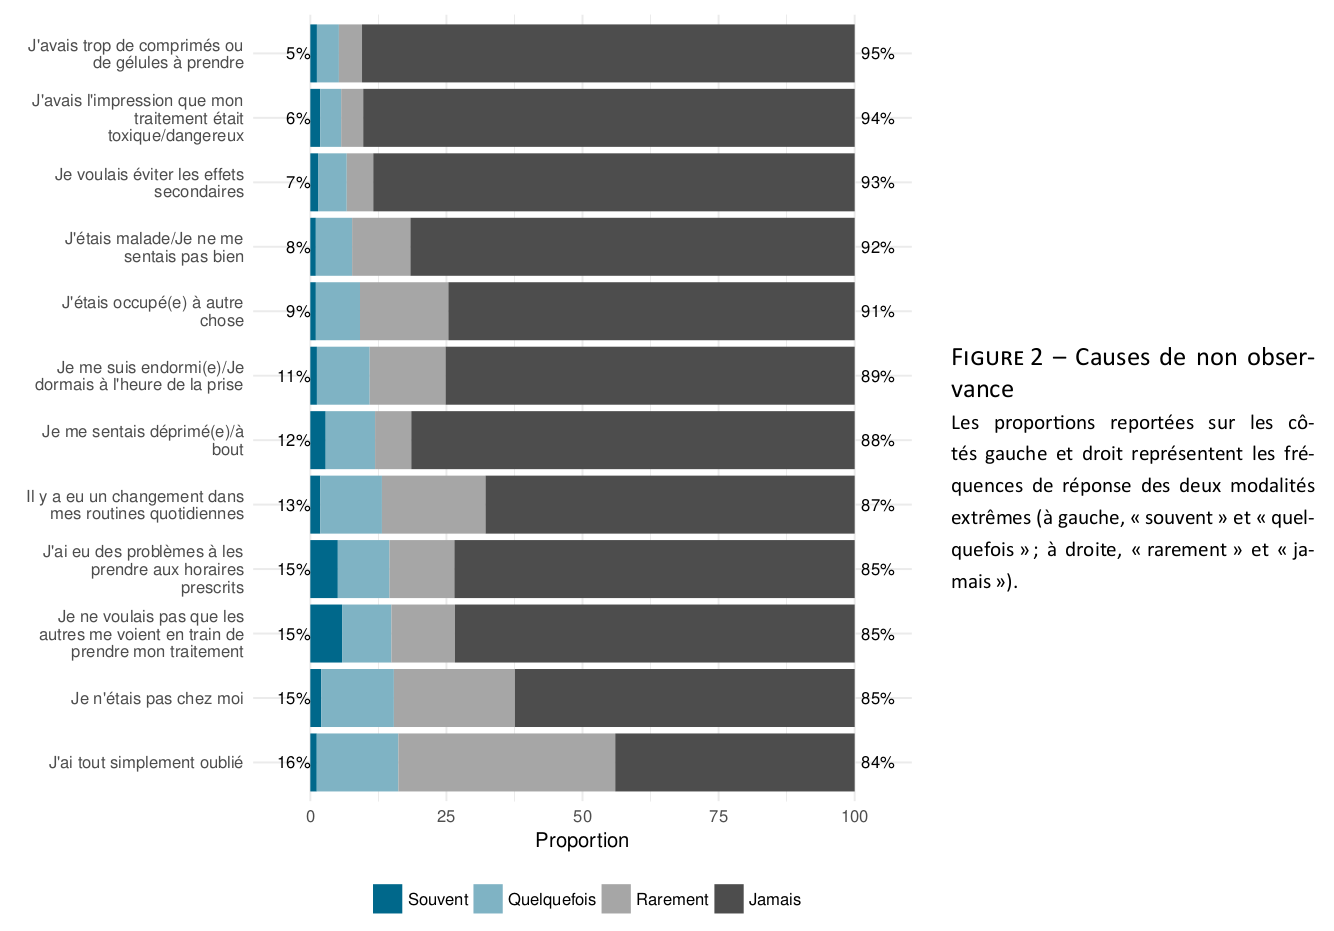
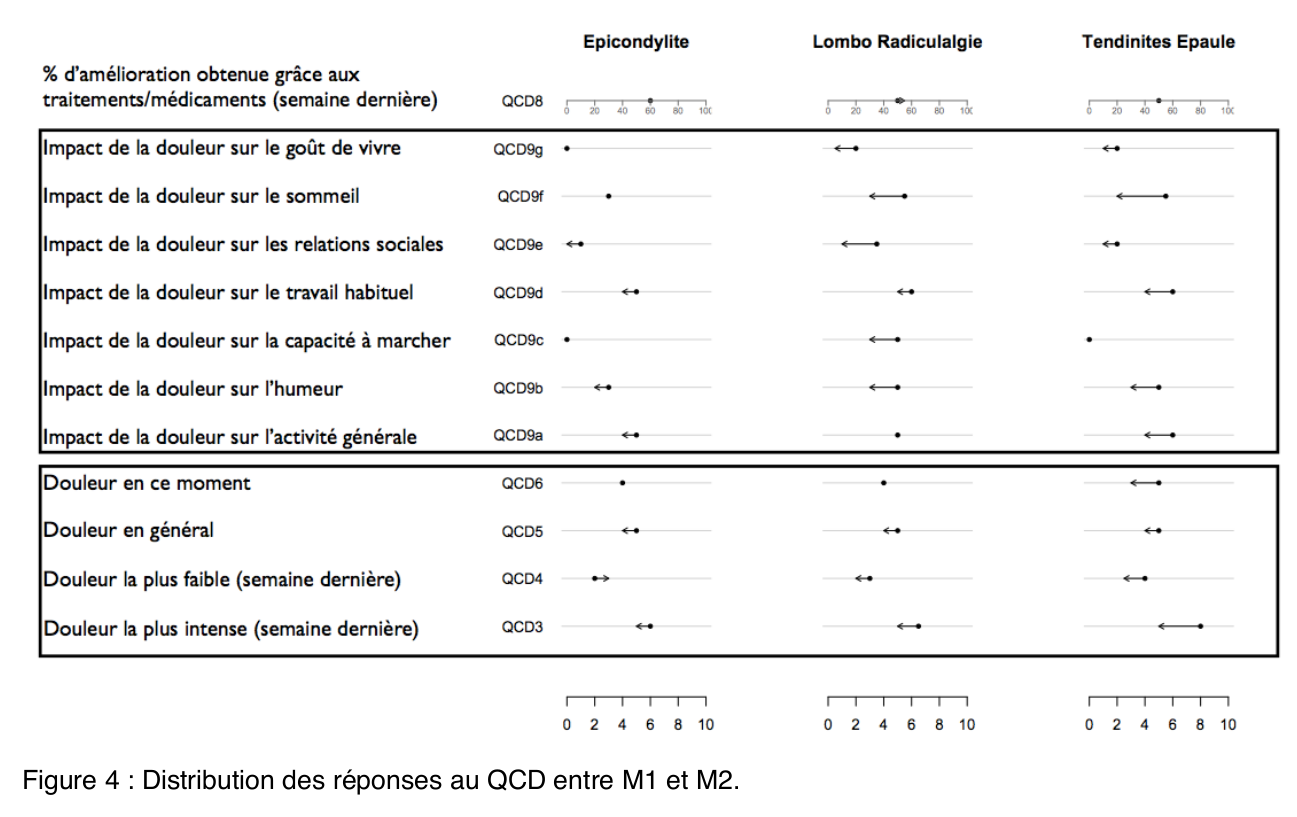
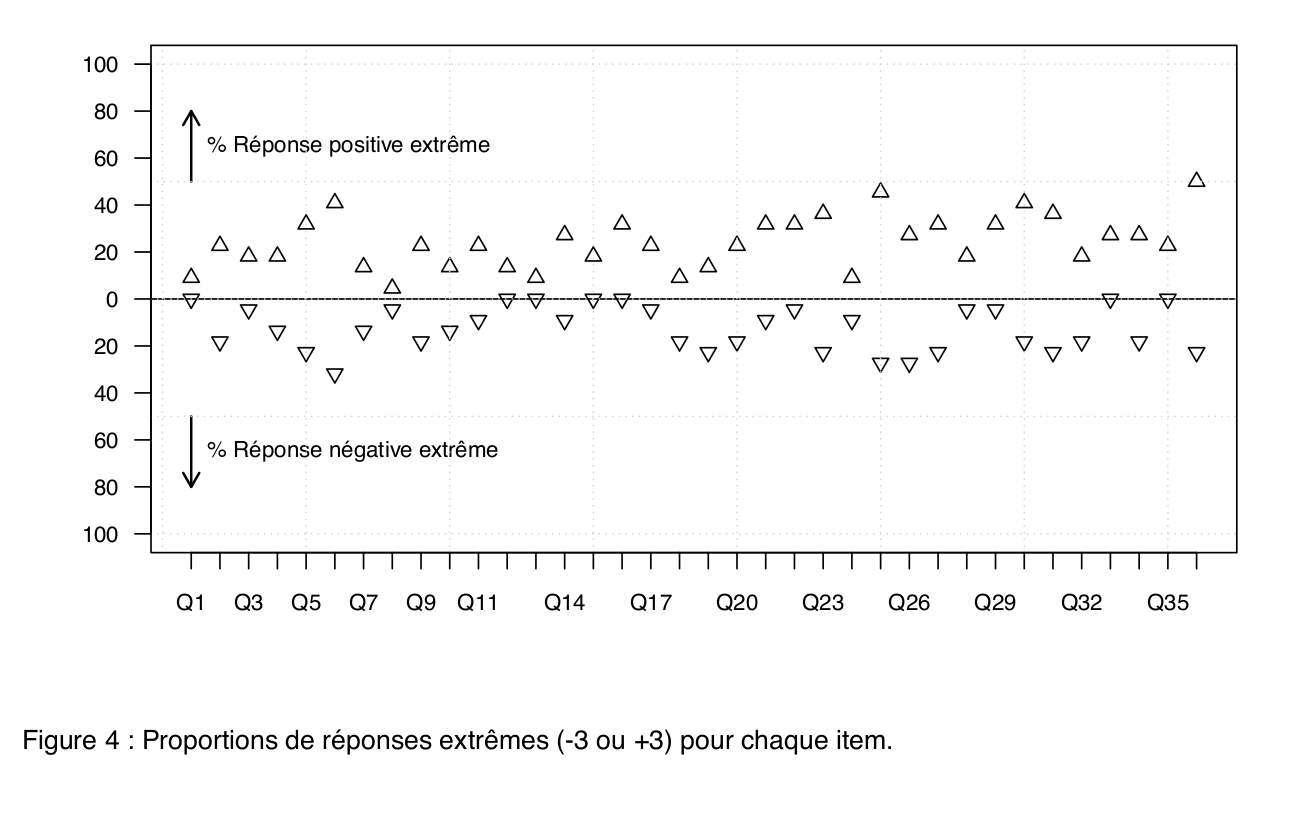
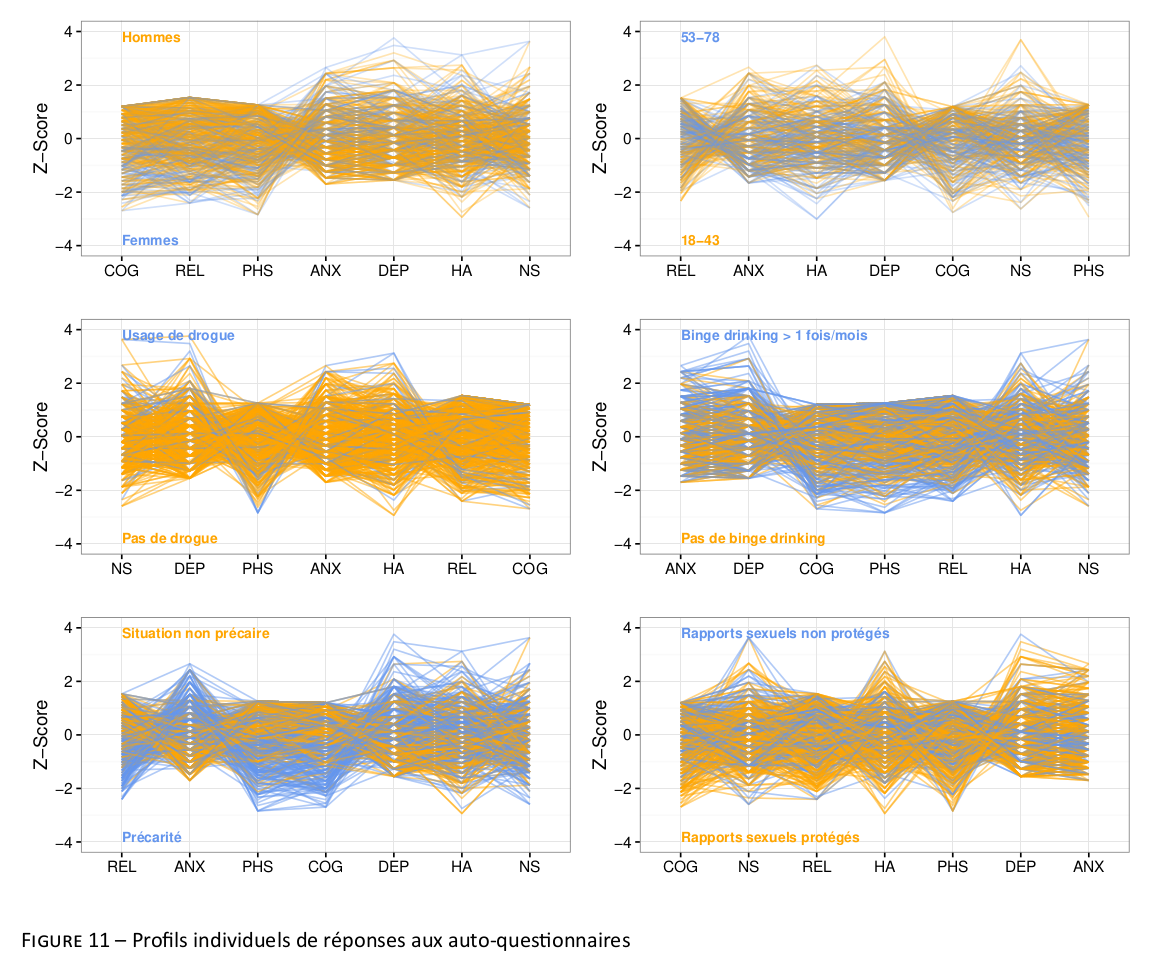
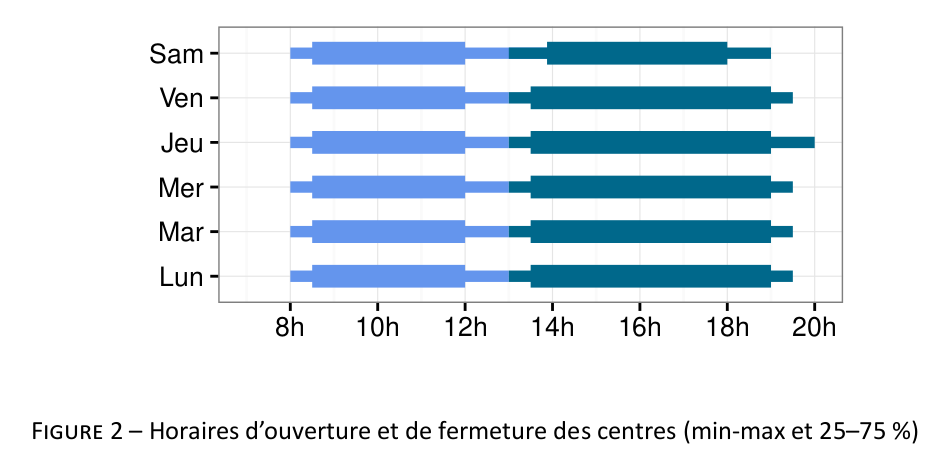
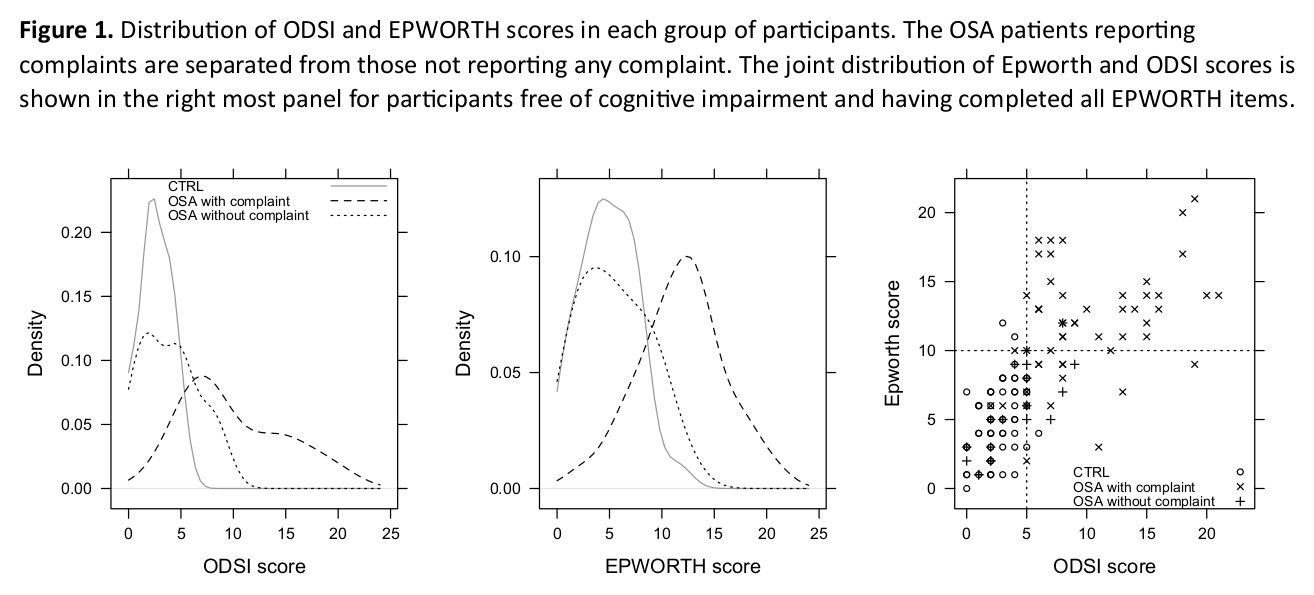
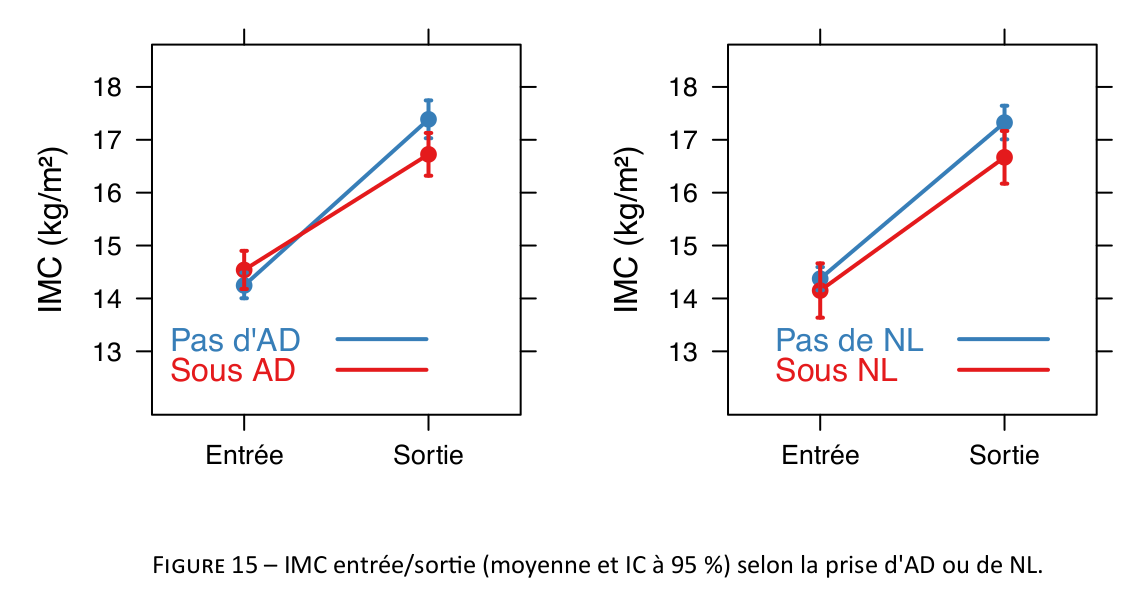
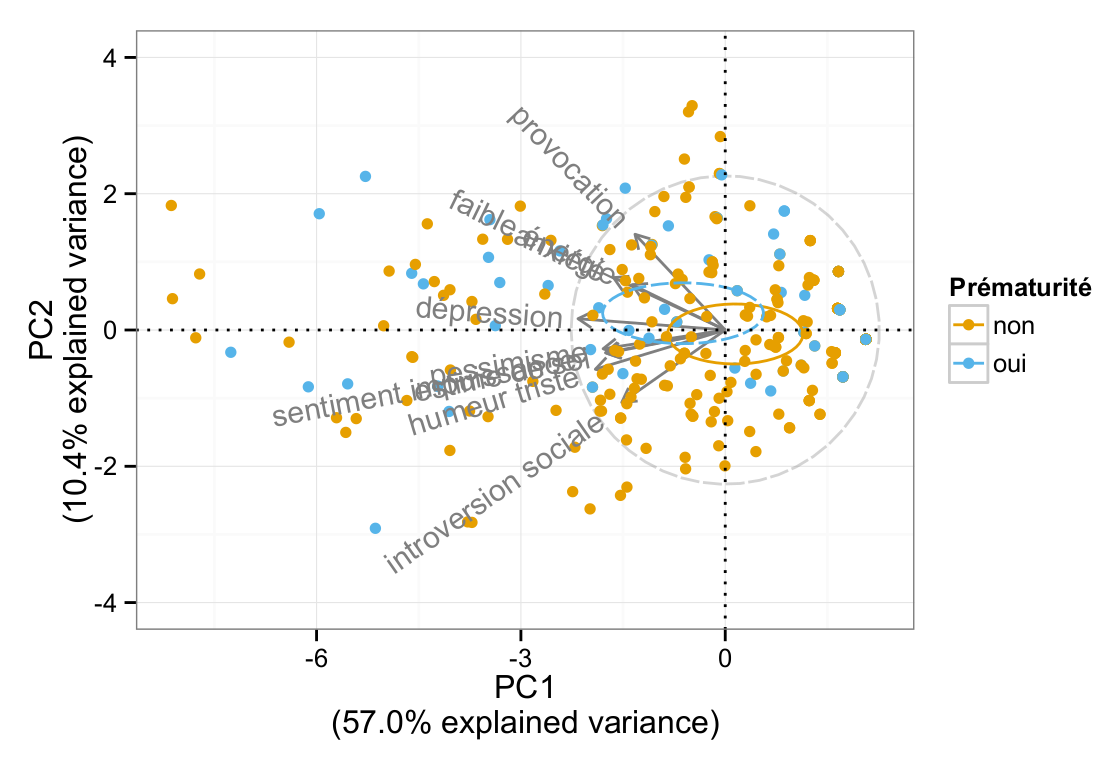
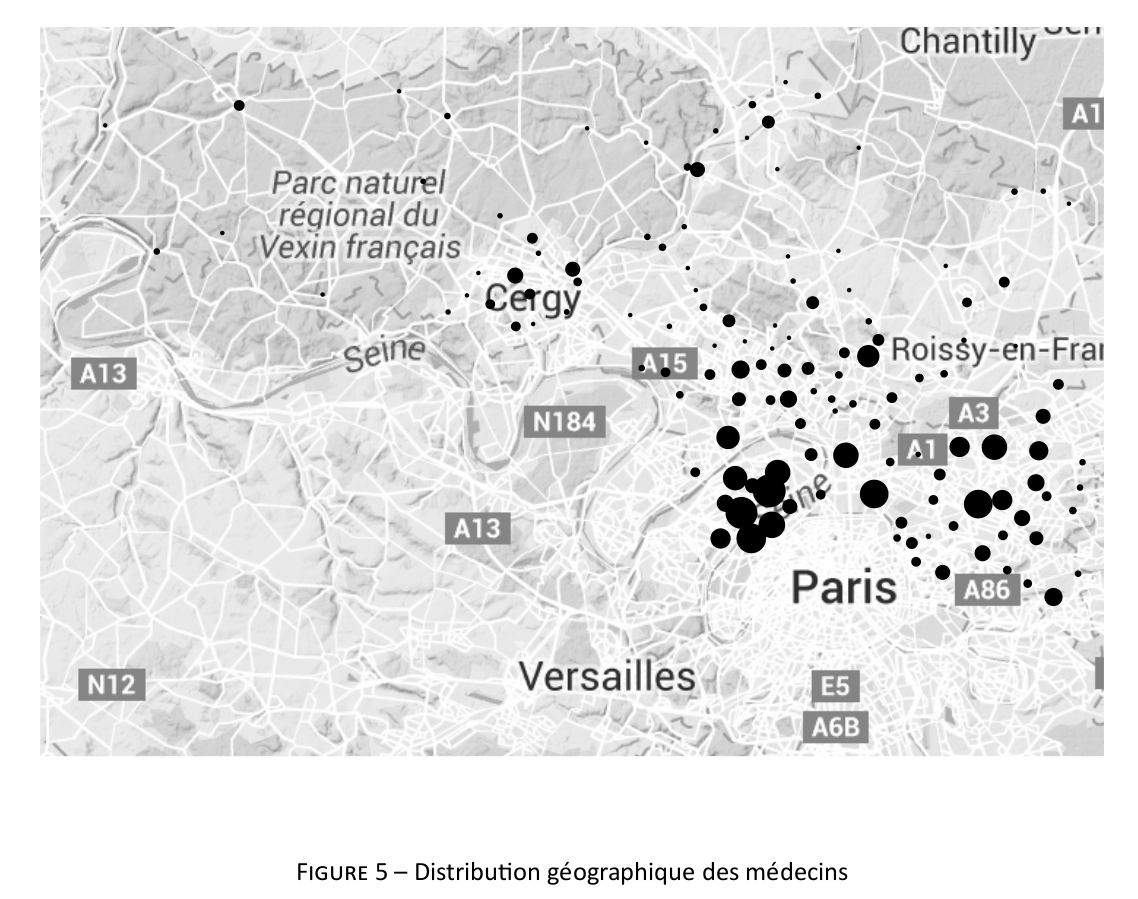
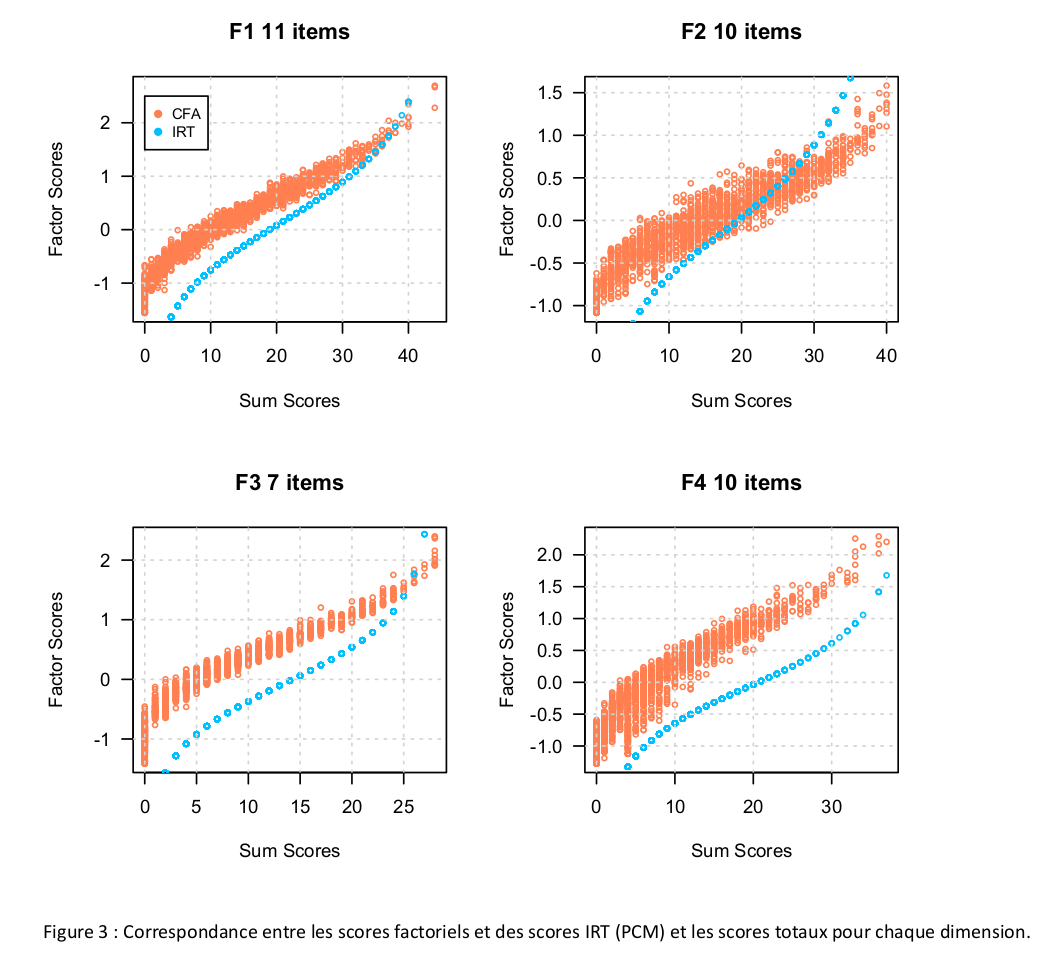
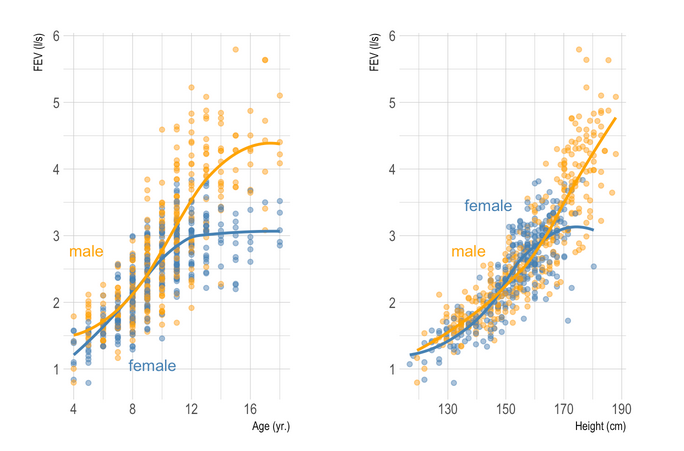
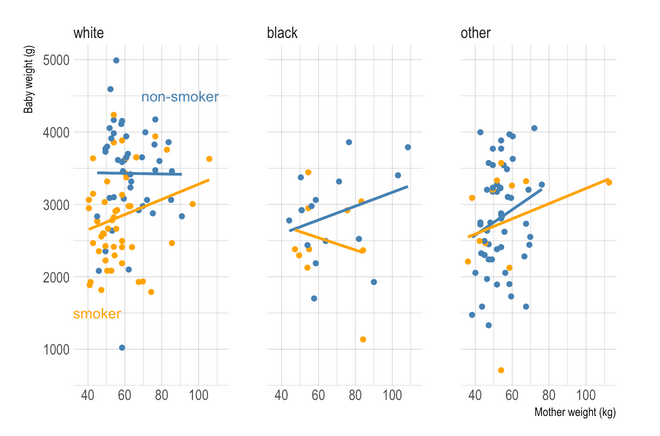
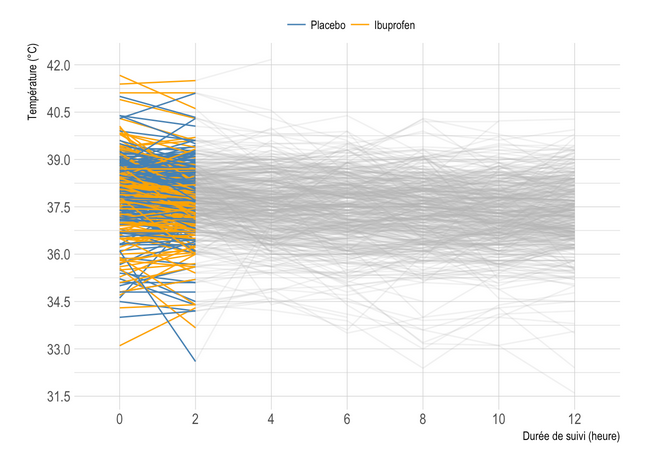
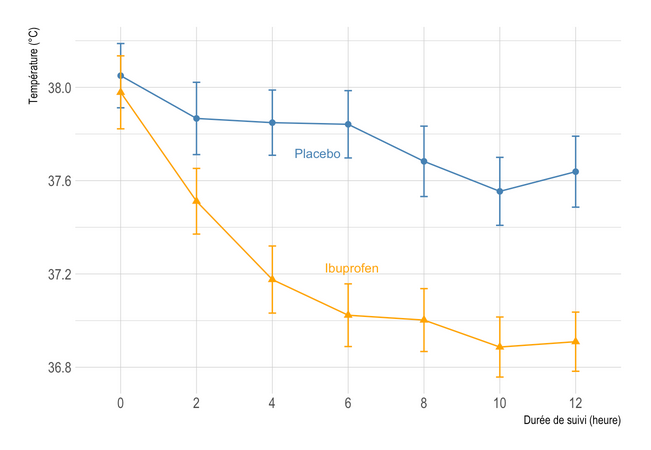
Here are a series of plots I made in R for statistical reports, articles, and handouts. That’s it (for the retrospective).


On a related point, I recently started drafting a short tutorial on how not to use “modern R” tools, and then I came across Frank Harrell’s excellent handout on his R workflow. Since I was going to make the apology of his packages, I think it’s best to start working on another handout. I will leave the foreword untouched below.
Although the tidyverse provides lot of packages that may be useful to perform common data preparation and univariate or multivariate statistical summaries, other solutions do exist. I am pretty confident that base-only R packages have been developed since I last used R for intensive data analysis (I can think of strengejacke’s packages for data visualization and data manipulation, for instance), but the Hmisc packages existed long before plyr, then dplyr, were published on CRAN, and it already worked pretty well. It’s still the best piece of software ever written for R after MASS, in my view. Together with the rms and ggplot2 packages, you will get the data munging triumvirate almost for free. Almost because you will have to learn a lot and to choose wisely among the numerous options. In addition, remember that “lightweight is the right weight”. If you can perform 80% of your tasks with three packages and builtin stuff, then you’re on the right side of the Pareto law. Here’s your starter kit for Hmisc.
Disclaimer: I have nothing against the tidyverse way of doing things (I just barely understand why we really need another “rlang”, and I regret the problems of reverse dependencies that it may have caused in the past). If that suits your needs, that’s all fine. If on the contrary you get stuck on basic data manipulation stuff, or built-in one-liner R functions don’t play well with “tibble”, then you’re probably going in the wrong direction. Start with Phil Spector’s textbook \cite{spector-2008-data-manip-r}, then eventually learn a bit of plyr \cite{wickham-2011-split-apply}. The 80% of time spent in data manipulation, as we use to say, is not a joke: You will likely spend most of your time switching from long to wide format, aggregating data all over again and again, and not just before even you start building your super nice statistical model.
See also Norm Matloff’s take on the tidyverse: Teach Base-R, Not Just the Tidyverse.
♪ IAMDDB • Silver Lines