Reproducible research with R
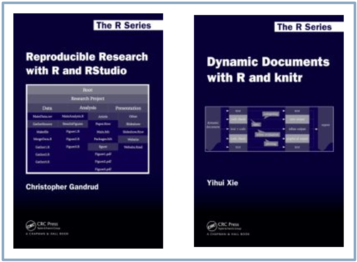
I just finished reading two recent books in the R Series from Chapman & Hall: Reproducible research with R and RStudio (Christopher Gandrud), and Dynamic documents with R and knitr (Yihui Xie).

Following my post on a good Workflow for statistical data analysis, I decided to take a look at the state of the art regarding the R statistical software. In fact, I’ve been using Sweave and knitr for a while now, and I tend to use knitr for everything but simple R scripts that can be self-contained.
There is now a plethora of R packages dedicated to writing MD or LaTeX tables: texreg, stargazer, apsrtable, rapport and pander, reporttools, brew. I should note that someone once asked about a list of such packages on Stack Overflow. Personally, I almost exclusively rely on the xtable and Hmisc packages, although I wish the latter could return HTML formatted tables in addition to $\LaTeX$ + PDF.
Regarding tools for Reproducible Research, there are also a lot of resources available on the internet. The last ones I checked are generally relying on R or Python (see, e.g., Fernando Perez’s work and talks, like Reproducible software vs. reproducible research). The SIAM 2011 conference included a mini-symposium on that particular aspect of scientific research: Verifiable, reproducible research and computational science. Karl Broman also has some very nice tutorials for his new course, Tools for Reproducible Research. Roger Peng has some articles on reproducible research. Incidentally, he created the SRPM package.1
The associated website for Reproducible research with R and RStudio includes chapter examples and sample Project files. This project can be compiled using GNU Makefile and knitr. Regarding the latter, the interested reader can browse
- Yihui Xie’s website
- The knitr book GitHub repository
- JSS review
Basically, this book reviews some of the prerequisites to perform reproducible data analysis: reflect the different steps of data analysis (data collection, data cleansing, statistical modeling and reporting) in different directories and subdirectories, use version control to keep a history of how the project did evolve with time and collaboration with others, sum up the results in static ($\LaTeX$ + PDF) and dynamic (HTML + e.g., googleVis) reports, and slideshow (Beamer or slidify). The point is that everything can be done with RStudio, which provides a unified interface to those aspects of data science. Even if I am more versed into Emacs and GNU tools for that, I must acknowledge that RStudio is really the best software to interact with R in a non-intrusive way (read, it’s not a “cliquodrome”), although it is clearly best suited for wide screen display. “Everything is a text file” sums up the essence of my own ideas in the past few years. One thing that is missing is package development, which is what I believe RStudio is really great for too. It may not be always the case that when analyzing data you need to build a dedicated package (see my review How to efficiently manage a statistical analysis project? on Cross Validated), but RStudio comes with handy tools to develop, test and deploy R packages.
Personally, I very much like these books that are available on GitHub: First you have the book almost for free (I often buy the book not to please the editor but to acknowledge the work and efforts made by the author), and you get some nice template to play with. In this case, everything is available on this GitHub repository. By the way, his course Introduction to Applied Data Analysis for Social Science is also available on GitHub.
Note that a new book was just published in the Chapman & Hall collection: Implementing Reproducible Research. Individual chapter files can be obtained at https://osf.io/s9tya/.
-
I wrote another post on Audit trails in statistical project, which discusses the track package. ↩︎