Revisiting Cronbach's alpha
While I was polishing statistical analyses for a paper including several instruments for neuropsychological assessment, I was puzzled by an article where authors reported using Cortina’s standard error [1] for Cronbach’s alpha. I usually give 95% confidence intervals computed by bootstrap (with BCA correction) and don’t rely on asymptotic distribution for this particular statistic.
The precision of Cronbach’s alpha depends on the standard error of items intercorrelations, and its SE takes the form:
$$ \frac{\text{SD}(r)}{\sqrt{\left(0.5\times k\times (k-1)\right)-1}} $$
where $\text{SD}(r)$ is the standard deviation of item intercorrelations and k is the number of items (Cortina, p. 100). It follows that if the intercorrelation matrix is constant, $\text{SE}(\alpha)=0$.
I don’t really like the overuse of Cronbach’s alpha, especially when it is not acknowledged as just a measure of the average between-item correlation. Cortina just nicely say that “precision of alpha, because it is a function of the spread of item correlations, reflects this range of correlations regardless of the source or sources of the range (e.g., measurement error or multidimensionality)”. If the measurement instrument is clearly multidimensional, then it follows that the variance of intercorrelation matrix increases, and in turn SE(α). Cortina also points to usual values of alpha considered as absolute thresholds, e.g. α > 0.70 (I would add 0.90 for comparison at the individual level):
Another lesson to be learned from Green et al’s (1977) Monte Carlo study is that alpha (either Cronbach’s or standardized) is a function of the number of items in a scale. Although most who use alpha pay lip-service to this fact, it seems to be forgotten when interpreting alpha. Most recent studies that have used alpha imply that a given level, perhaps greater than .70, is adequate or inadequate without comparing it with the number of items in the scale. Any perusal of the recent literature in applied psychology supports this statement. This acceptance of α > .70 as adequate is implied by the fact that α > .70 usually goes uninterpreted. It is merely presented, and further scale modifications are seldom made. This is clearly an improper usage of the statistic.
A similar point was raised by Schmitt [2].
Below, I show how Cronbach’s α evolves as the number of items, the average item intercorrelation and the dimensionality are varied. It is merely Cortina’s Table 2 converted to a more compact chart. I didn’t add the standard error, though.
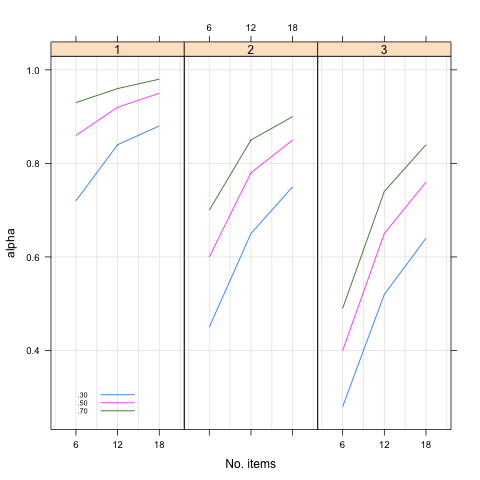
As can be seen, lower internal consistencies are found for low number of items, low average item correlation, and when there is no unidimensionality. I happened to produce a similar plot as follows (it needs cronbach_alpha.R, which may be download as Gist 595886):
library(lattice)
library(mvtnorm)
source("cronbach_alpha.R")

sim.cor.data <- function(n, p, rho) {
	  S <- matrix(1,nc=p,nr=p)
	  S[upper.tri(S)] <- rho #+runif(p,-eps,+eps)
	  S <- S+t(S)-1
	  X <- rmvnorm(n, sigma=S)
	  return(X)
}

rr <- seq(0.5, 0.9, by=.1)
kk <- seq(5, 100, by=10)
sim.design <- expand.grid(rho=rr, sample=kk)

len <- nrow(sim.design)
res <- numeric(len)
for (i in 1:len)
	  res[i] <- cronbach.alpha(sim.cor.data(n=300,
                                            rho=sim.design[i,1],
	                                        p=sim.design[i,2]))$statistic

res.df <- cbind(sim.design,res)
xyplot(res~sample, data=res.df, groups=rho, type=c("g","b"),
       pch=1:5, lty=1:5, col= "black", panel=panel.superpose,
       xlab="No. items", ylab=expression(alpha[C]),
       key=list(corner=c(0.93,0.07),
                text=list(as.character(rr),col="black"),
	            points=T, pch=1:5, lty=1:5,
                title=expression(rho),cex=.6))
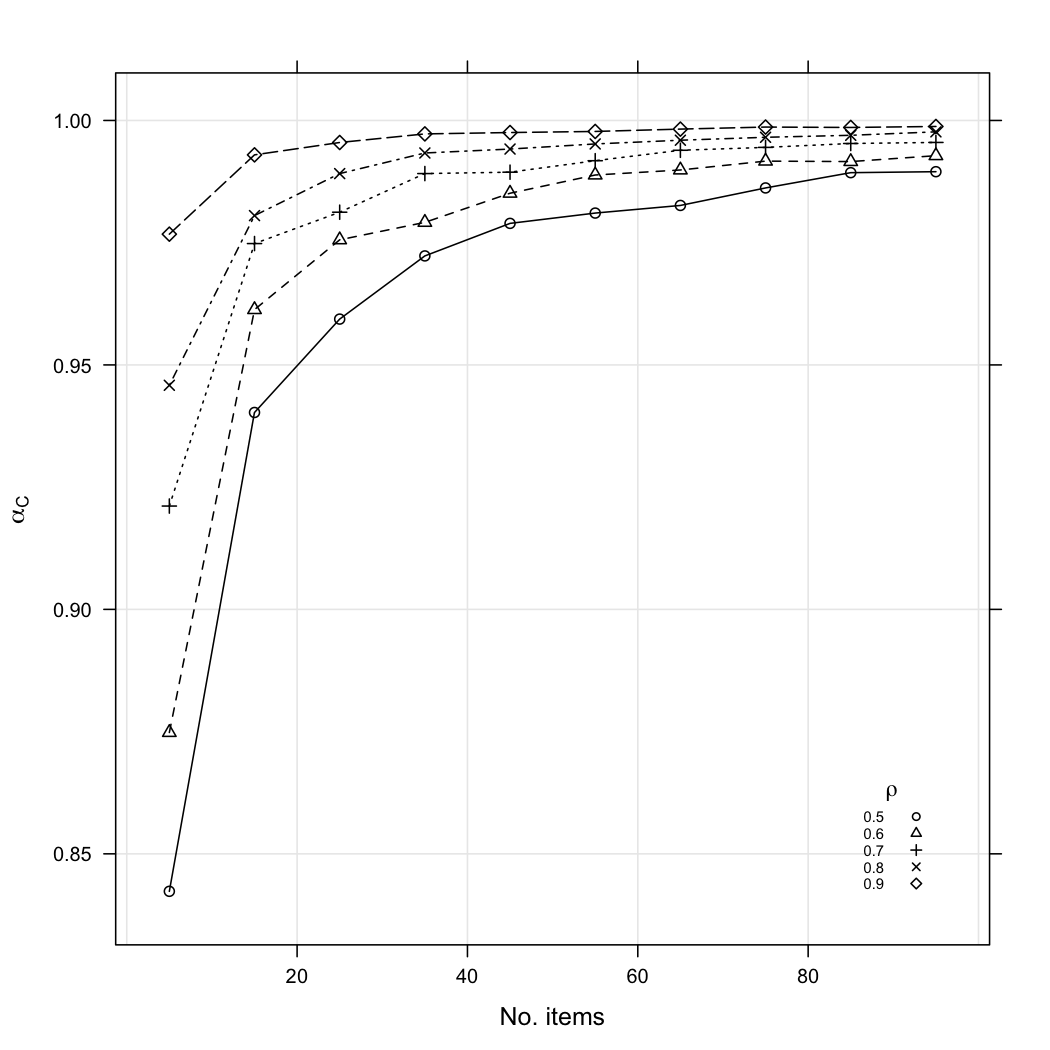
For a fixed sample size (N = 300), Cronbach’s alpha increases when the number of items and inter-items correlation (ρ) are also increasing. Even with modest (albeit perfect) correlation between items, e.g. ρ = 0.35, Cronbach’s α would still be at 0.943 with 30 items (and 0.910 with 20 items). Varying sample size does not modify this pattern of variation.
Inferential procedures for the α statistic seem to have a long history, from Feldt [3-5] to Duhachek [6,7] to name a few. Shevlin et al. [8] also ran Monte Carlo studies and show how departure from the unidimensionality assumption (through extraneous variables or systematic error) inflates Cronbach’s α:
Further, high reliability is generally cited as evidence of good psychometric properties of a scale. However, a high estimate of alpha may be indicating the presence of systematic errors. These extraneous variables can make a substantial contribution to alpha rather than the actual trait that is being attempted to be measured. In particular it has been shown that when the factor loadings of the trait being measured are low, the presence of systematic errors can greatly in ̄ate the estimate of alpha, especially with large sample sizes.
A recent paper published in Health and Quality of Life Outcomes even suggests that Cronbach’s α might be adjusted to take into account inconsistent responses. I just skimmed through the paper, but the results section looks interesting:
Contrary to common belief, random responses may inflate Cronbach’s alpha when their mean differ from that of the true responses. Fixed responses inflate Cronbach’s alpha except in scales with both positive and negative polarity items. In general, the bias in Cronbach’s alpha due to inconsistent responses may change from negative to positive with an increasing number of items in a scale, but the effect of additional items beyond around 10 becomes small. The number of response categories does not have much influence on the impact of inconsistent responses.
References
- Cortina, J.M. (1993). What Is Coefficient Alpha? An Examination of Theory and Applications. Journal of Applied Psychology, 78(1), 98-104.
- Schmitt, N. (1996). Uses and Abuses of Coefficient Alpha. Psychological Assessment, 8(4), 350-353.
- Feldt, L.S. (1990). The sampling theory for the intraclass reliability coefficient. Applied Measurement in Education, 3, 361-367.
- Feldt, L.S., Woodruff, D.J., and Salih, F.A. (1987). Statistical inference for coefficient alpha. Applied Psychological Measurement, 11, 93-103.
- Charter, R.A. and Feldt, L.S. (1996). Testing the equality of two alpha coefficients. Perceptual and Motor Skills, 82, 763-738.
- Duhachek, A. and Iacobucci, D. (2004). Alpha’s Standard Error (ASE): An Accurate and Precise Confidence Interval Estimate. Journal of Applied Psychology, 89(5), 792-808.
- Iacobucci, D. and Duhachek, A. (2003). Advancing Alpha: Measuring Reliability With Confidence. Journal of Consumer Psychology, 13(4), 478-487.
- Shevlin, M., Miles, J.N.V., Davies, M.N.O., and Walker, S. (2000). Coefficient alpha: a useful indicator of reliability?. Personality and Individual Differences, 28, 229-237.
- Fong, D.Y.T., Ho, S.Y., and Lam, T.H. (2010). Evaluation of internal reliability in the presence of inconsistent responses. Health and Quality of Life Outcomes, 8,27.