Stata plot the week #5
It’s not really a new venture into graphing data with Stata since I already did the hard job a few years ago, but I wanted to try out my new setup. I never really used the Stata do editor beforehand (I started using Stata when it was version 9 or 10 and stopped at version 15), and since I got an MP version I could simply summon Stata from the command line. Now that I upgraded to Stata 19 BE (I’m running on low budget nowadays), I don’t have access to Stata from the terminal anymore. This means I updated my Neovim config to send Stata code dorectly to the running GUI:
-- after/ftplugin/stata.lua
local function send_visual_to_stata()
  local old_reg = vim.fn.getreg('"')
  local old_regtype = vim.fn.getregtype('"')
  vim.cmd('normal! "zy')
  local selection = vim.fn.getreg("z")
  vim.fn.setreg('"', old_reg, old_regtype)
  local escaped = selection:gsub("\\", "\\\\"):gsub('"', '\\"')
  local applescript = string.format(
    [[osascript -e 'tell application "StataBE" to DoCommandAsync "%s"']],
    escaped
  )
  vim.fn.system(applescript)
end

vim.keymap.set("v", "s", send_visual_to_stata, { desc = "Send visual selection to Stata" })
That’s okay, I use the same mapping as the one I use to send visual selection to running REPL in a Neovim terminal. Now I’m just checking that StataBE.app is runnig in the background and send my visual selection to the app instead of the builtin terminal.
Anyway, here are two plots I produced using Stata 13 3 years ago (EPS files converted to 300 DPI PNG files):
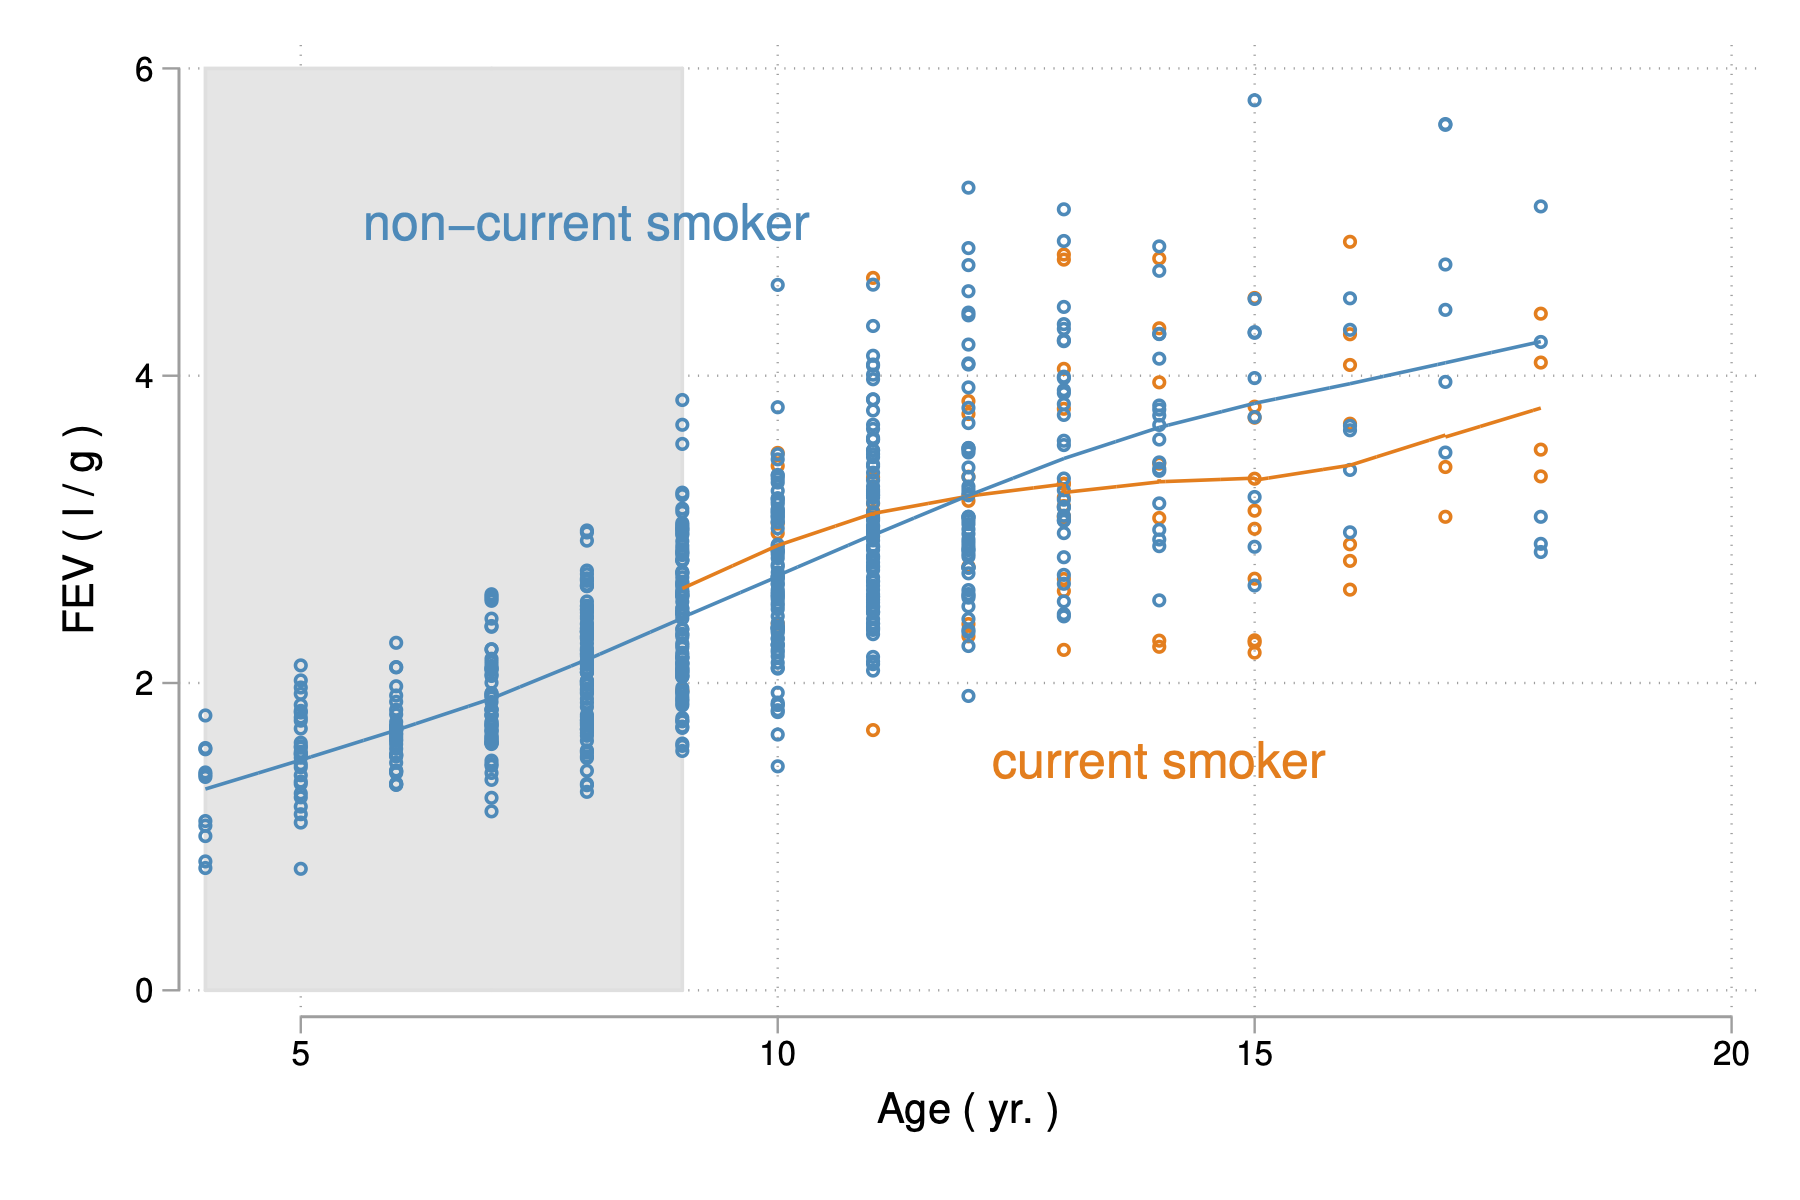
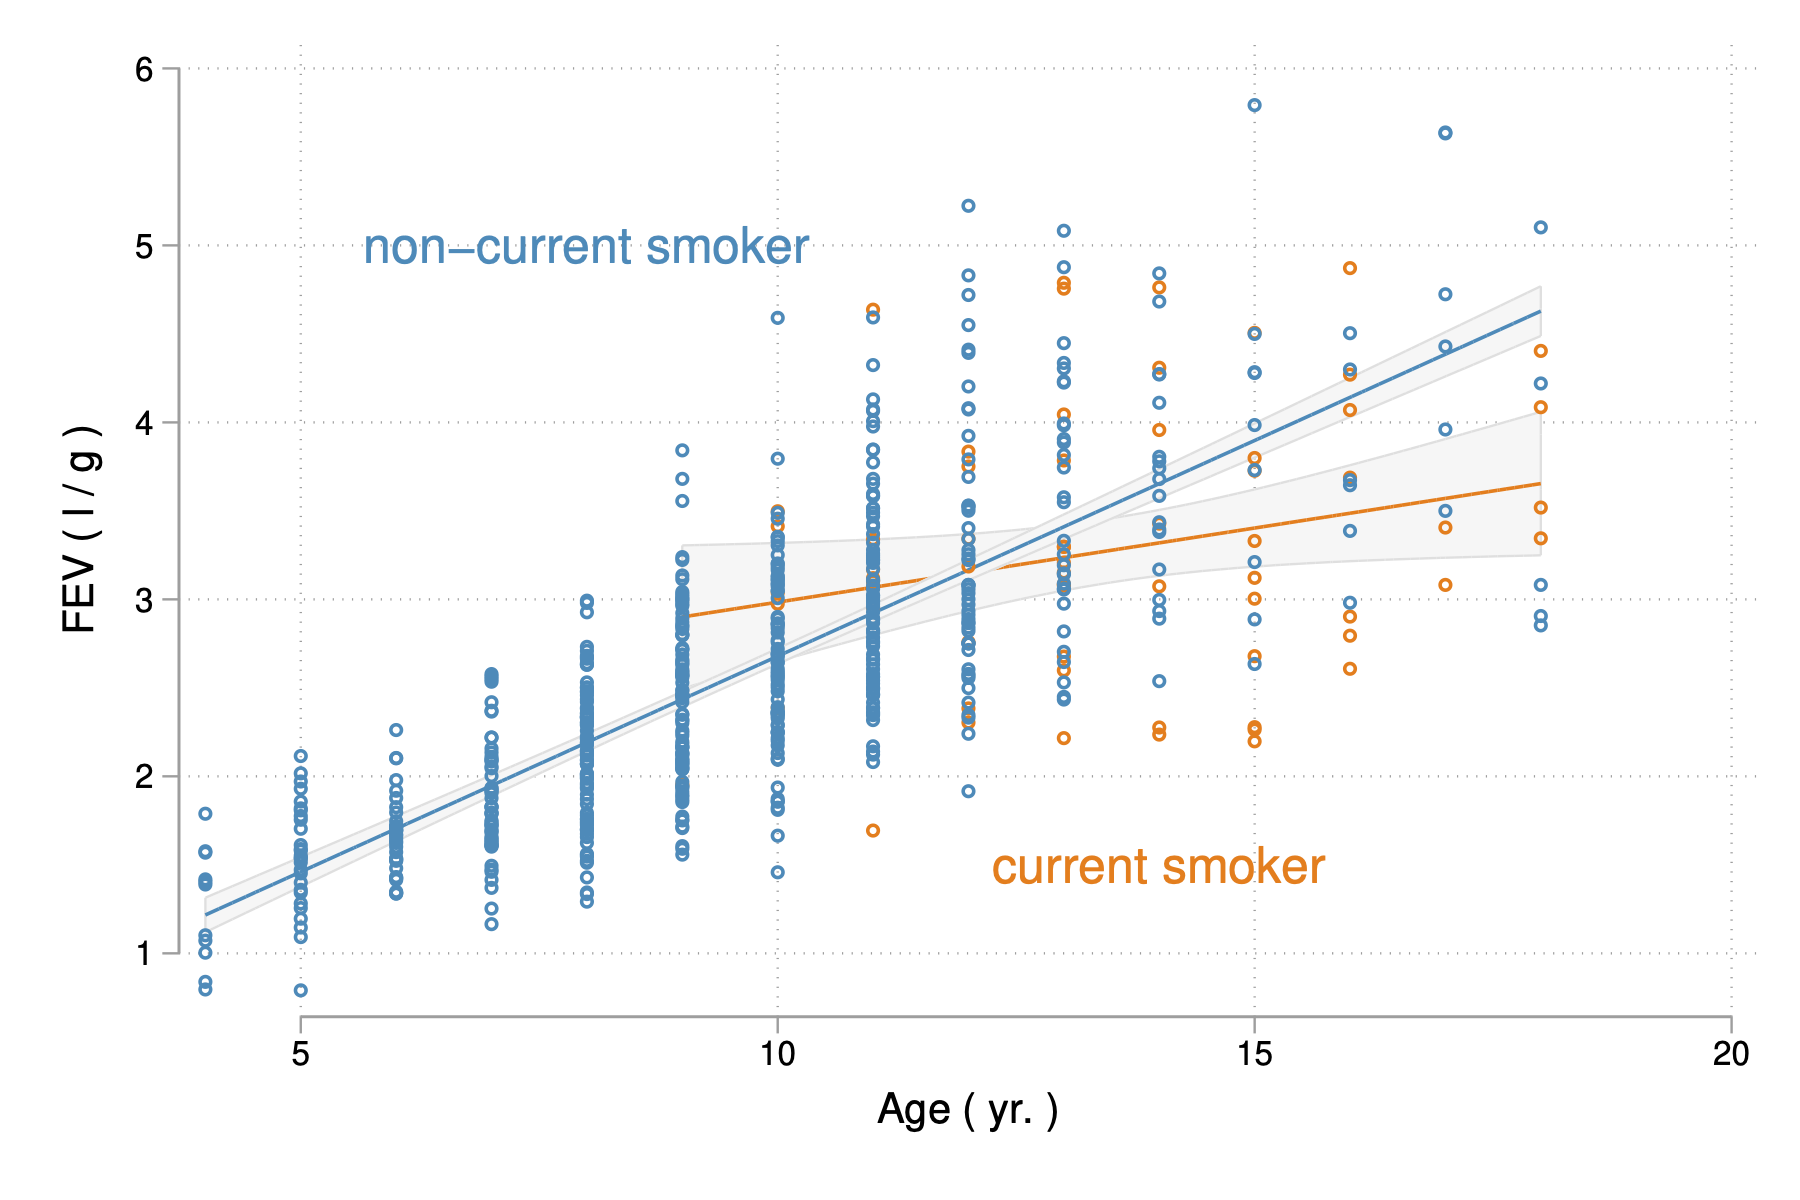
As can be seen, these are highly customized Stata graphics. I used the blue/orange color scheme popularized by the Elements of Statistical Learning. Otherwise, I usually relied on the blindschemes. My original code is available on GitHub. These are figures 02-07 and 02-08.
What about using the default Stata color scheme now? I’m not sure what old Stata would have produced. Here’s the first figure updated with all the defaults:
graph twoway (rarea low high age if age <= 9, sort color(gs14)) (scatter fev age if smoke == 1, ms(oh) text(1.5 14 "current smoker", size(medlarge))) (scatter fev age if smoke == 2, ms(oh) text(5 8 "non-current smoker", size(medlarge))) (lowess fev age if smoke == 1, lp(l)) (lowess fev age if smoke == 2, lp(l)), legend(off) xtitle (Age (yr.)) ytitle (FEV (l/g))
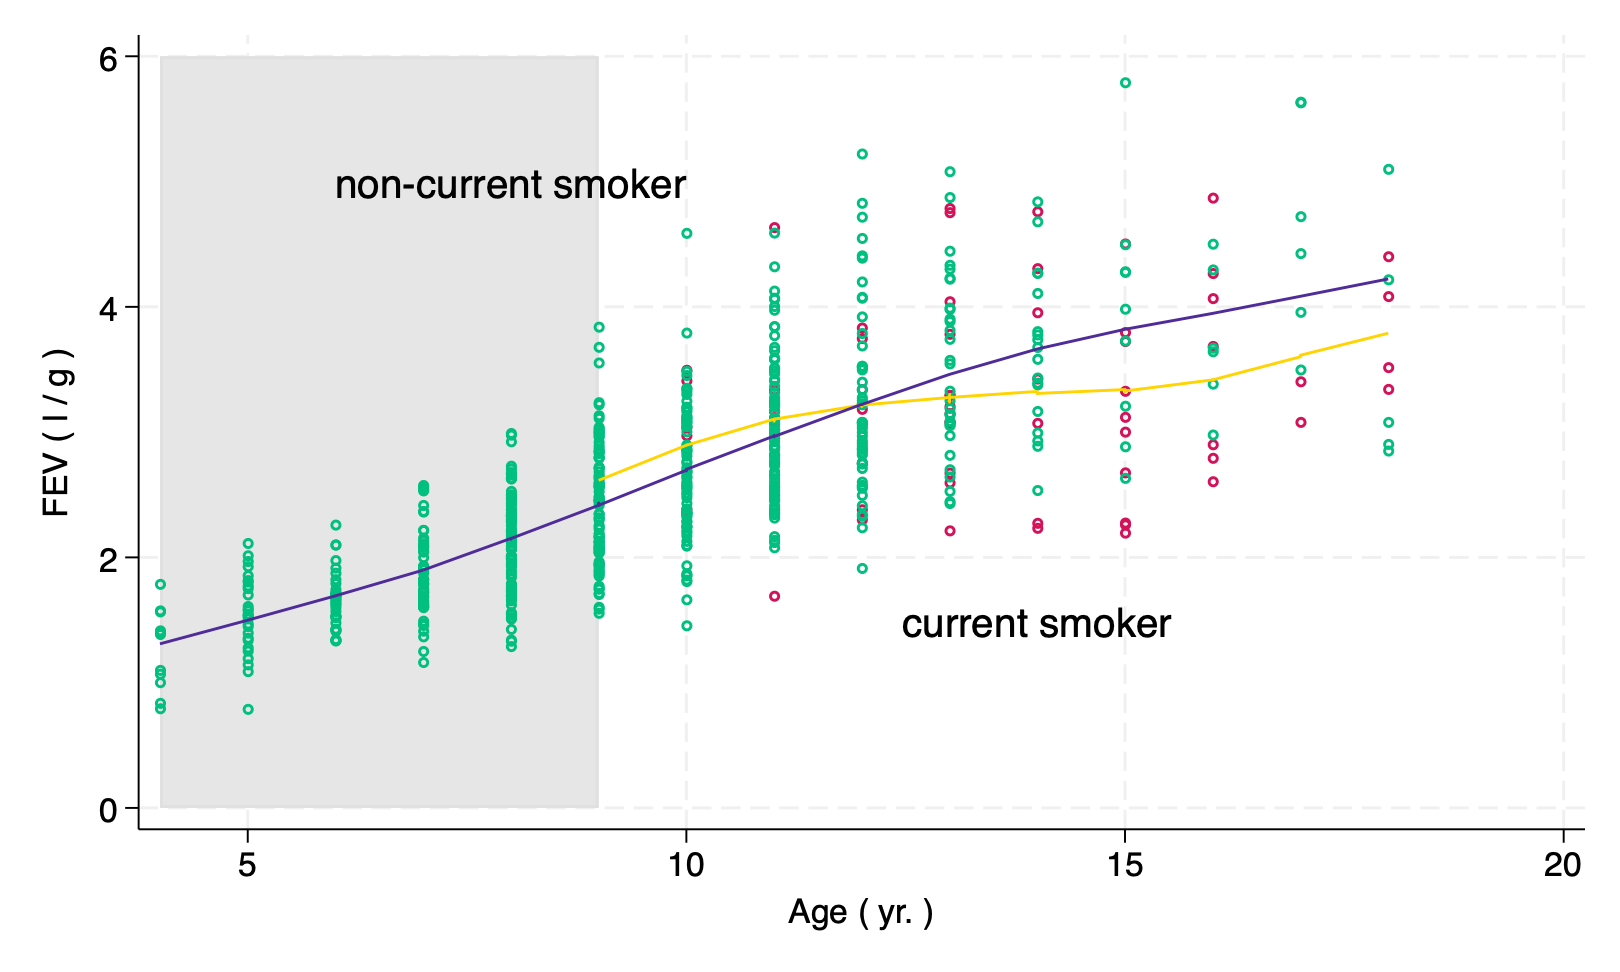
Not that bad. I would love if line and point got the same color automagically. I still prefer my own version, but the updated default qualitative palette looks ggod to me.
♪ Bananarama • Time Out