Statistics for terrified biologists
I came across a good deal of statistics handbooks for biologists over the past 15 or 20 years, and lately I’ve seen some textbooks with R or Python applications. I think this is good, yet few biologists use them effectively. In no particular order, I can think of:
- Jerrold H. Zar (2010) Biostatistical Analysis, London, UK: Pearson: My very first exposition to biostatistical analysis after years of statistics for psychology and data analysis “à la française”;
- Bernard Rosner. (2016) Fundamentals of biostatistics. Boston, MA: Cengage Learning: One of the textbook I used in my own courses and tutorials because Rosner was a reference at some point;
- John H. McDonald, Handbook of Biological Statistics: Available online.
- Rafael A. Irizarry & Michael I. Love, Data Analysis for the Life Sciences with R: It used to be available online, and you will certainly find the PDF somewhere on the interweb.
You will find plenty of textbooks on applied biostatistics using Python (especially in bioinformatics) or R.
This book, Statistics for terrified biologists by Helmut van Emden, stands out by its clear exposition of fundamental concepts like the relevance of the normal distribution or summarizing variations as sum of squares, which naturally leads to the question of degrees of freedom:
However, degrees of freedom crop up often in statistical calculations, and are not always just one less than the total number of numbers. So it is perhaps worth making an effort to understand the concept of degrees of freedom. The two important basics of the concept are (i) that we are calcu lating statistics from a sample rather than the entire population of numbers and (ii) that the total of the numbers in the sample is used to calculate the mean which is then used as the basis for the deviations that contribute to the sum of squares.
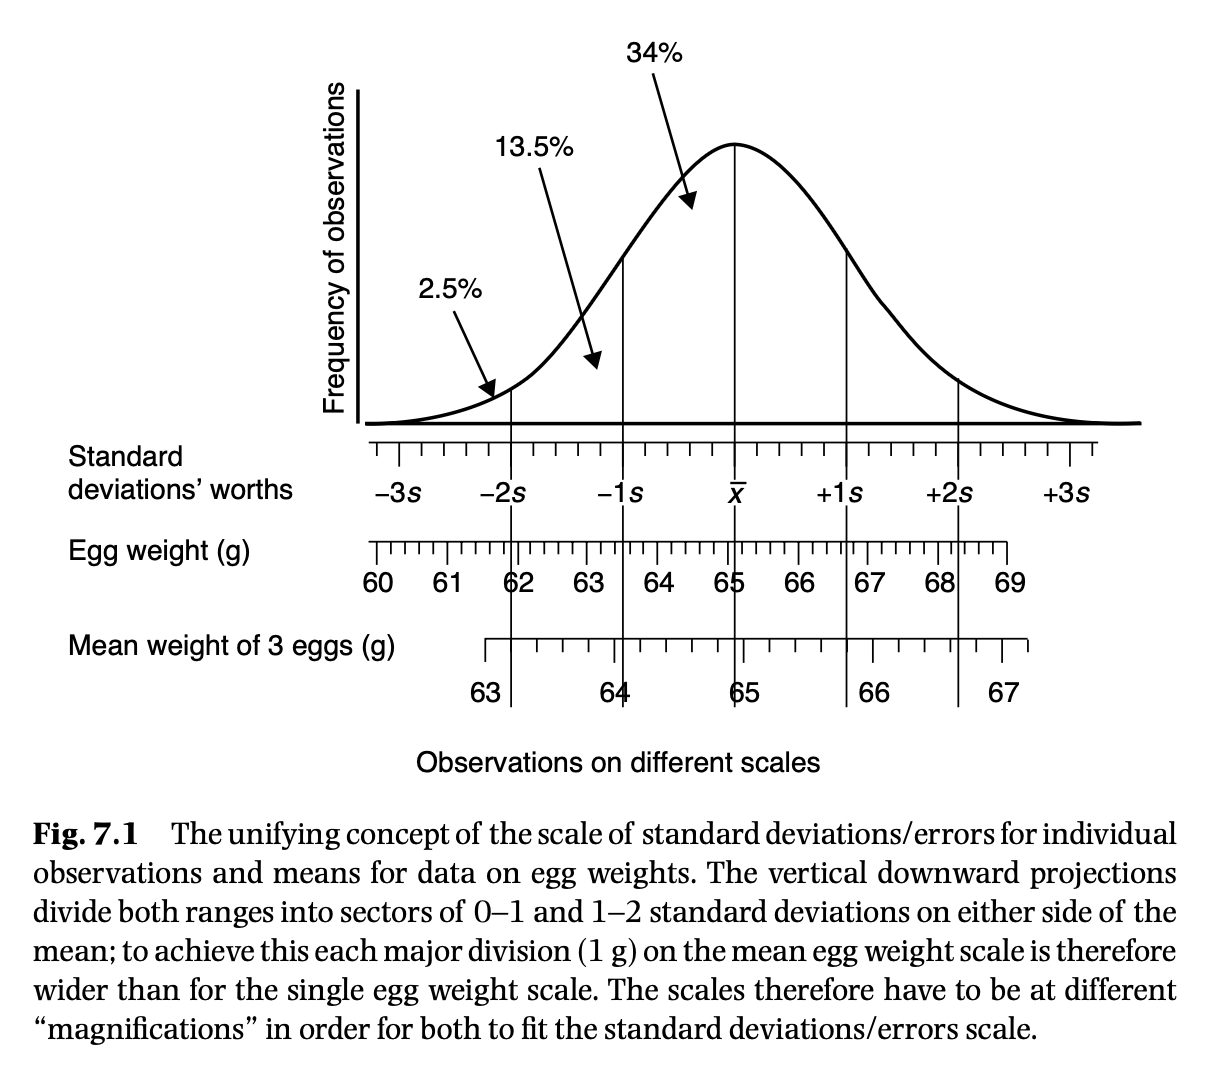
Illustrations are very appealing, with nomograms and clear indications of what is depicted and how to read the figure.
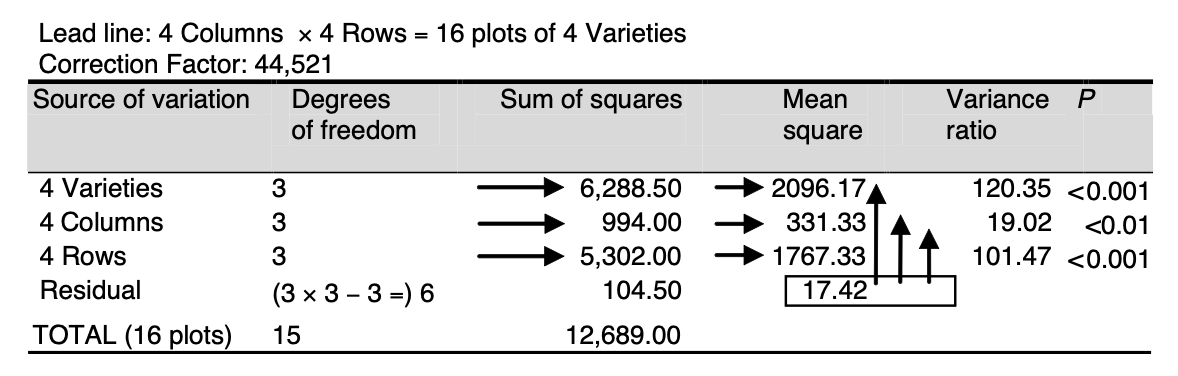
There’s also a fair amount of time devoted to the design of experiments, including factorial experiments, of course, randomized and incomplete blocks, but also split-plot designs. Again, nice illustrations are provided to help the reader conceptualize how observations fit in a given deign (Chapter 11). Likewise, ANOVA computation are explained by hand, which is great:
This is especially true in Chapter 16 when the author explains, step by step, how least significant differences are to be interpreted depending of the experimental setup.
Unfortunately, the author mentioned the number of subjects needed somewhere in chapter 6, but nothing is said about power analysis. Having worked in the medical field for over 10 years, I would say this is the basis of designing an experimental study; otherwise, how would you be able to justify that missing the critical 5 percent threshold was due to an underpowered study plan to any reviewer? (little joke about post-hoc power analysis)
Little is said about the connection between ANOVA, the t-test, and the theory of linear models, but this little gem (Fig. 17.10) reminds me of Bill Huber’s beautiful depiction of how covariance acts the way it does:
everybody get out your crayons!
That should be the motto for data exploration in statistics, IMHO!
♪ The Undertones • The Love Parade