Pretty printing statistical distribution tables
Before using statistical software, we learned to use standard tables for finding the quantile of a standard normal or a Student’s t distribution, given a type 1 risk. Here is a way to quickly print them on a PDF file using R and $\LaTeX$.
The R part
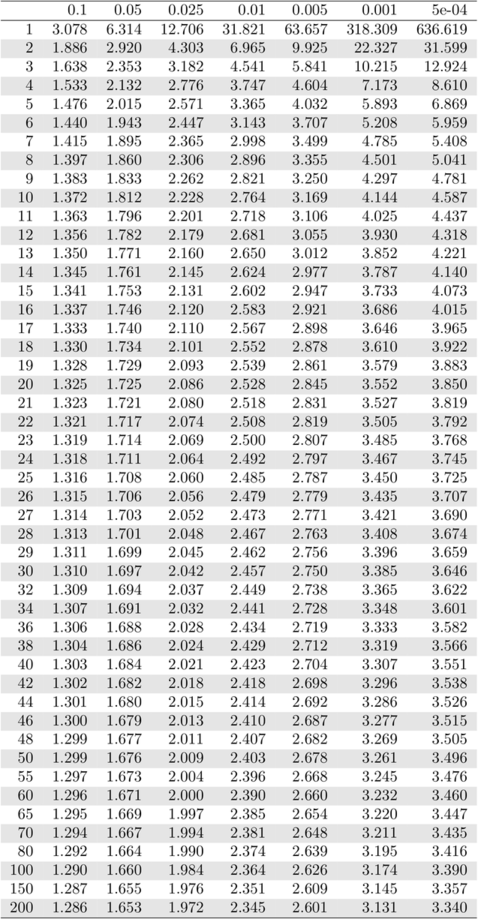
I’m considering this Table as an example of what I want to achieve.
pp <- c(.10, .05, .025, .01, .005, .001, .0005)
dof <- c(1:30, seq(32, 50, by=2), 55, 60, 65, 70, 80, 100, 150, 200)
res <- matrix(nc=length(pp), nr=length(dof), dimnames=list(dof, pp))
for (i in seq_along(pp))
  res[,i] <- qt(p=pp[i], df=dof, lower.tail=F)
Then, we just have to export this table as a standalone tex file:
library(xtable)
res.tex <- xtable(res, digits=3)
print(res.tex, floating=FALSE, file="t-dist.tex",
      add.to.row=list(list(seq(1, length(dof), by=2)), "\\rowcolor[gray]{.9} "))
The TeX part
Using $\LaTeX$, I just wrote a wrapper file like this:
\documentclass{standalone}
\usepackage{colortbl}
\begin{document}
\input{t-dist}
\end{document}
The result is shown below: