Visual Statistics – Use R!
“Let’s not kid ourselves, the most widely used piece of software for statistics is Excel” (Brian Ripley). Now I believe that even biologists could learn R for good using this neat textbook written by Alexey Shipunov: Visual Statistics–User R!
This textbook is the kind of “statistic without math” but with R.
As the author announces at the beginning of this book, it is not about statistical modeling or advanced concepts like the use of pre-specified contrasts in complex analysis of variance, nor about more specialized techniques like those found in survival analysis, spatial statistics or psychometrics. However, this textbook focus on learning R, where the motto is try things out for yourself, and with some little gems like this one:
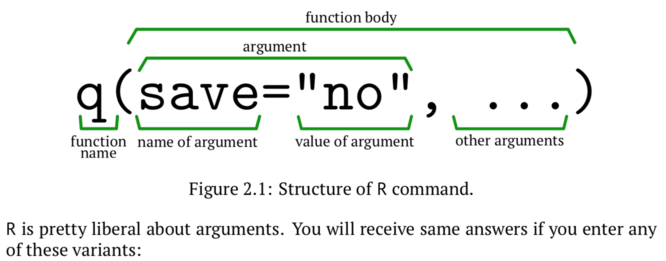
Likewise, there is is this nice take away message, early in chapter 1, when trying to decipher what log10(((sqrt(sum(c(2, 2))))^2)*2.5) could possibly produce as a result: “R expressions are in some way similar to Russian doll, or to onion, or to artichoke, and to analyze them, one should peel it (emphasis is mine).”
I spent a good time reading this book as it reminded me of old school R (at least, the way I learned it). You learn how to load file using plain old read.table instructions, stack data frame, and to save your work using sink. Who use sink or capture nowadays? I even learn some new stuff, like the fact that abline(line(x, y)) will plot a Tukey median-median “robust” line (I struggle to find why since nothing like this is mentioned in the online help for abline until I realized I read lines instead of line), or the effsize package which provides effect size measure for nonparametric tests. The author also makes heavy use of base graphics (as Richard McElreath does in his book Statistical Rethinking), with a bit of lattice, which is nice since it allows to get some fresh air, away from ggplot2, which still remain one of the most useful package to be added to the recommended ones. While talking about visual statistics, I also learned about correlation pleiads, which are used to summarize a correlation matrix in a circular display. I know a lot of ways to display a correlation matrix, or special case thereof, as in focused PCA, but the following one is really nice:
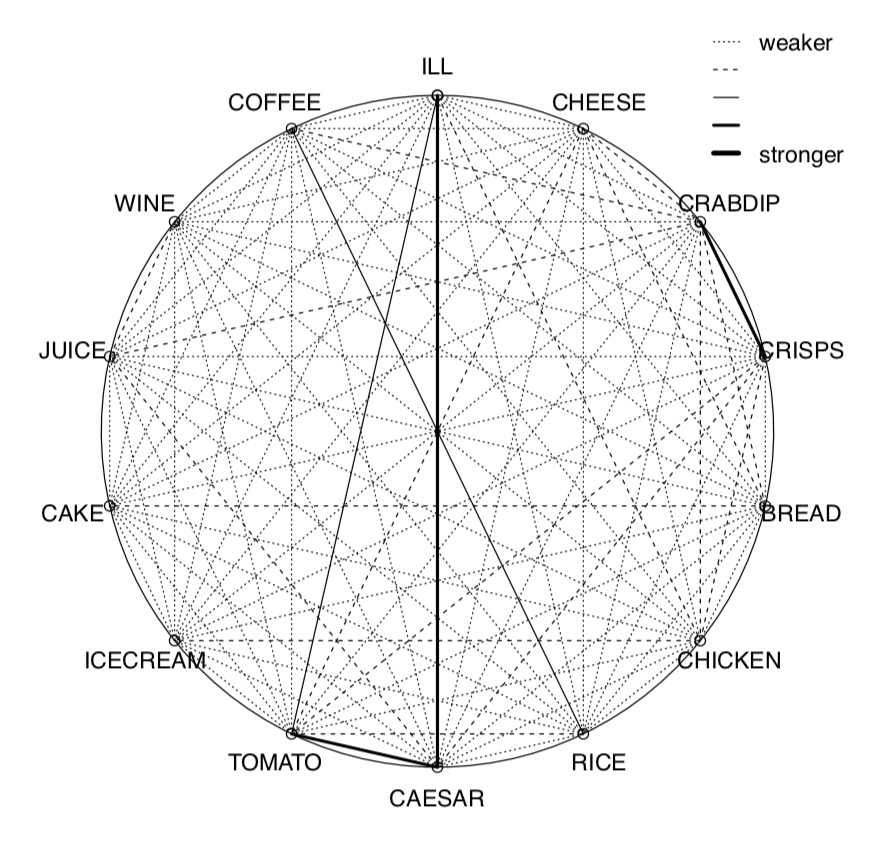
See also this PDF article if you want to learn more about the ecological significance of correlation pleaides.
Part II of the book was the most interesting for me since it deals with multivariate analysis, including PCA and multidimensional scaling, correspondence analysis, and clustering. The last chapter is about supervised learning, and even if it consists in just a short overview of available methods and the rationale for using any of them, it remains quite interesting after all the material discussed in the preceding chapter.
Not sure I really agree with the recommendation on which model to choose (§9.8)–try them all!–since I’m highly biased in favor of Frank Harrell’s approach to statistical modeling, but let that not stop you reading the whole textbook. I was also a bit surprised to see no mention of RStudio in place of default R applications, especially on Windows. I am not sure that “the data are ‘parametric’” means anything in mathematical statistics since parameterization relates to distribution, not data per se. But these are minor issues, of course, given the quality of the presentation. I have always been a firm believer of the empirical approach to learning statistics, and I still think that understanding and analyzing data is better than understanding the mathematical properties of the underlying models. In that sense I would have really liked to start learning R with such a book on hand.