Figure caption goes here.
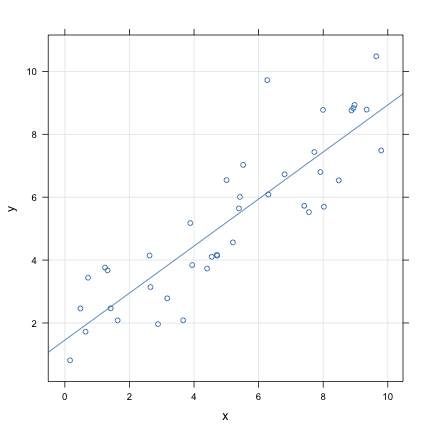
Here is a basic setup to illustrate linear regression. Let's generate some data like \(y = 1.1+0.8x+\varepsilon\), where \(\varepsilon\sim\mathcal{N}(0;1)\):
n <- 40
x <- runif(n, min = 0, max = 10)
y <- 1.1 + 0.8 * x + rnorm(n)
and a basic scatter display of the artificial dataset
xyplot(y ~ x, type = c("p", "g", "r"))
Figure caption goes here.
Here is model output from lm:
##
## Call:
## lm(formula = y ~ x)
##
## Residuals:
##    Min     1Q Median     3Q    Max
## -2.109 -0.816 -0.064  0.739  3.581
##
## Coefficients:
##             Estimate Std. Error t value Pr(>|t|)
## (Intercept)    1.455      0.389    3.74    6e-04 ***
## x              0.748      0.066   11.33  9.6e-14 ***
## ---
## Signif. codes:  0 '***' 0.001 '**' 0.01 '*' 0.05 '.' 0.1 ' ' 1
##
## Residual standard error: 1.2 on 38 degrees of freedom
## Multiple R-squared: 0.771,   Adjusted R-squared: 0.765
## F-statistic:  128 on 1 and 38 DF,  p-value: 9.6e-14
##
Of course, we can do many other fancy things, but see knitr Chunk options and package options.
For example, if you have the Hmisc package (you should really have it), you can try the following:
library(Hmisc)
f <- function(x, digits = 1) c(mean = round(colMeans(x), digits = digits), range = paste(apply(x,
    2, range), collapse = "-"))
summary(low ~ ., data = birthwt, method = "reverse", overall = TRUE)
##
##
## Descriptive Statistics by low
##
## +------------+-----------------+-----------------+-----------------+
## | |No |Yes |Combined |
## | |(N=130) |(N=59) |(N=189) |
## +------------+-----------------+-----------------+-----------------+
## |age | 19.0/23.0/28.0 | 19.5/22.0/25.0 | 19.0/23.0/26.0 |
## +------------+-----------------+-----------------+-----------------+
## |lwt |113.0/123.5/147.0|104.0/120.0/130.0|110.0/121.0/140.0|
## +------------+-----------------+-----------------+-----------------+
## |race : White| 56% (73) | 39% (23) | 51% (96) |
## +------------+-----------------+-----------------+-----------------+
## | Black | 12% (15) | 19% (11) | 14% (26) |
## +------------+-----------------+-----------------+-----------------+
## | Other | 32% (42) | 42% (25) | 35% (67) |
## +------------+-----------------+-----------------+-----------------+
## |smoke : Yes | 34% ( 44) | 51% ( 30) | 39% ( 74) |
## +------------+-----------------+-----------------+-----------------+
## |ptl : 0 | 91% (118) | 69% ( 41) | 84% (159) |
## +------------+-----------------+-----------------+-----------------+
## | 1 | 6% ( 8) | 27% ( 16) | 13% ( 24) |
## +------------+-----------------+-----------------+-----------------+
## | 2 | 2% ( 3) | 3% ( 2) | 3% ( 5) |
## +------------+-----------------+-----------------+-----------------+
## | 3 | 1% ( 1) | 0% ( 0) | 1% ( 1) |
## +------------+-----------------+-----------------+-----------------+
## |ht : Yes | 4% ( 5) | 12% ( 7) | 6% ( 12) |
## +------------+-----------------+-----------------+-----------------+
## |ui : Yes | 11% ( 14) | 24% ( 14) | 15% ( 28) |
## +------------+-----------------+-----------------+-----------------+
## |ftv : 0 | 49% ( 64) | 61% ( 36) | 53% (100) |
## +------------+-----------------+-----------------+-----------------+
## | 1 | 28% ( 36) | 19% ( 11) | 25% ( 47) |
## +------------+-----------------+-----------------+-----------------+
## | 2 | 18% ( 23) | 12% ( 7) | 16% ( 30) |
## +------------+-----------------+-----------------+-----------------+
## | 3 | 2% ( 3) | 7% ( 4) | 4% ( 7) |
## +------------+-----------------+-----------------+-----------------+
## | 4 | 2% ( 3) | 2% ( 1) | 2% ( 4) |
## +------------+-----------------+-----------------+-----------------+
## | 6 | 1% ( 1) | 0% ( 0) | 1% ( 1) |
## +------------+-----------------+-----------------+-----------------+
## |bwt | 2948/3267/3651 | 1928/2211/2396 | 2414/2977/3487 |
## +------------+-----------------+-----------------+-----------------+summary(bwt ~ ., data = birthwt, fun = f)## bwt N=189
##
## +-------+---------+---+--------+---------+
## | | |N |mean.bwt|range |
## +-------+---------+---+--------+---------+
## |low |No |130|3329.1 |2523-4990|
## | |Yes |59 |2097.3 |709-2495 |
## +-------+---------+---+--------+---------+
## |age |[14,20) |51 |2973.5 |1885-4238|
## | |[20,24) |56 |2919.6 |1588-4111|
## | |[24,27) |36 |2828.4 |1330-4593|
## | |[27,45] |46 |3033.8 |709-4990 |
## +-------+---------+---+--------+---------+
## |lwt |[ 80,112)|53 |2656.3 |1330-3997|
## | |[112,122)|43 |3058.7 |709-4593 |
## | |[122,141)|46 |3074.6 |1021-4990|
## | |[141,250]|47 |3038 |1135-4174|
## +-------+---------+---+--------+---------+
## |race |White |96 |3102.7 |1021-4990|
## | |Black |26 |2719.7 |1135-3860|
## | |Other |67 |2805.3 |709-4054 |
## +-------+---------+---+--------+---------+
## |smoke |No |115|3055.7 |1021-4990|
## | |Yes |74 |2771.9 |709-4238 |
## +-------+---------+---+--------+---------+
## |ptl |0 |159|3013.5 |1021-4990|
## | |1 |24 |2496.3 |709-4174 |
## | |2 |5 |2766.8 |1885-3317|
## | |3 |1 |3637 |3637-3637|
## +-------+---------+---+--------+---------+
## |ht |No |177|2972.2 |709-4990 |
## | |Yes |12 |2536.8 |1135-3790|
## +-------+---------+---+--------+---------+
## |ui |No |161|3030.7 |1135-4990|
## | |Yes |28 |2449.4 |709-3912 |
## +-------+---------+---+--------+---------+
## |ftv |0 |100|2865.1 |709-4238 |
## | |1 |47 |3108 |1588-4990|
## | |2 |30 |3010.3 |1021-4167|
## | |3 |7 |2521.9 |2126-2835|
## | |4 |4 |3167.8 |2301-3860|
## | |6 |1 |3303 |3303-3303|
## +-------+---------+---+--------+---------+
## |Overall| |189|2944.6 |709-4990 |
## +-------+---------+---+--------+---------+summary(low ~ smoke + ht + ui, data = birthwt, fun = table)## low N=189
##
## +-------+---+---+---+---+
## | | |N |No |Yes|
## +-------+---+---+---+---+
## |smoke |No |115| 86|29 |
## | |Yes| 74| 44|30 |
## +-------+---+---+---+---+
## |ht |No |177|125|52 |
## | |Yes| 12| 5| 7 |
## +-------+---+---+---+---+
## |ui |No |161|116|45 |
## | |Yes| 28| 14|14 |
## +-------+---+---+---+---+
## |Overall| |189|130|59 |
## +-------+---+---+---+---+Pandoc allows to customize HTML or PDF output through default or custom theme. It is also easy to include bibliographic entries the usual way, e.g. @wickham11 will read Wickham (2011).
Wickham, H. 2011. “The Split-Apply-Combine Strategy for Data Analysis.” Journal of Statistical Software 40.