Clifford attractors
I came across some nice visualization of Clifford attractors on Antonio Sánchez Chinchón’s website, which is dedicated to experiments in R (mostly using ggplot): Drawing 10 Million Points With ggplot: Clifford Attractors. Other graphics can be found on Paul Bourke’s website. A Javascript version is also available.
Peter de Jong attractors are relevant too and can be found on the same website. For a more general discussion, see Strange Attractors: Creating Patterns in Chaos, by Julien C. Sprott.
Clifford attractors are defined by the following recurrence equations:
$$ \begin{align} x_{n+1} & = \sin(a y_n) + c\cos(a x_n) \newline y_{n+1} & = \sin(b x_n) + d\cos(b y_n) \end{align} $$
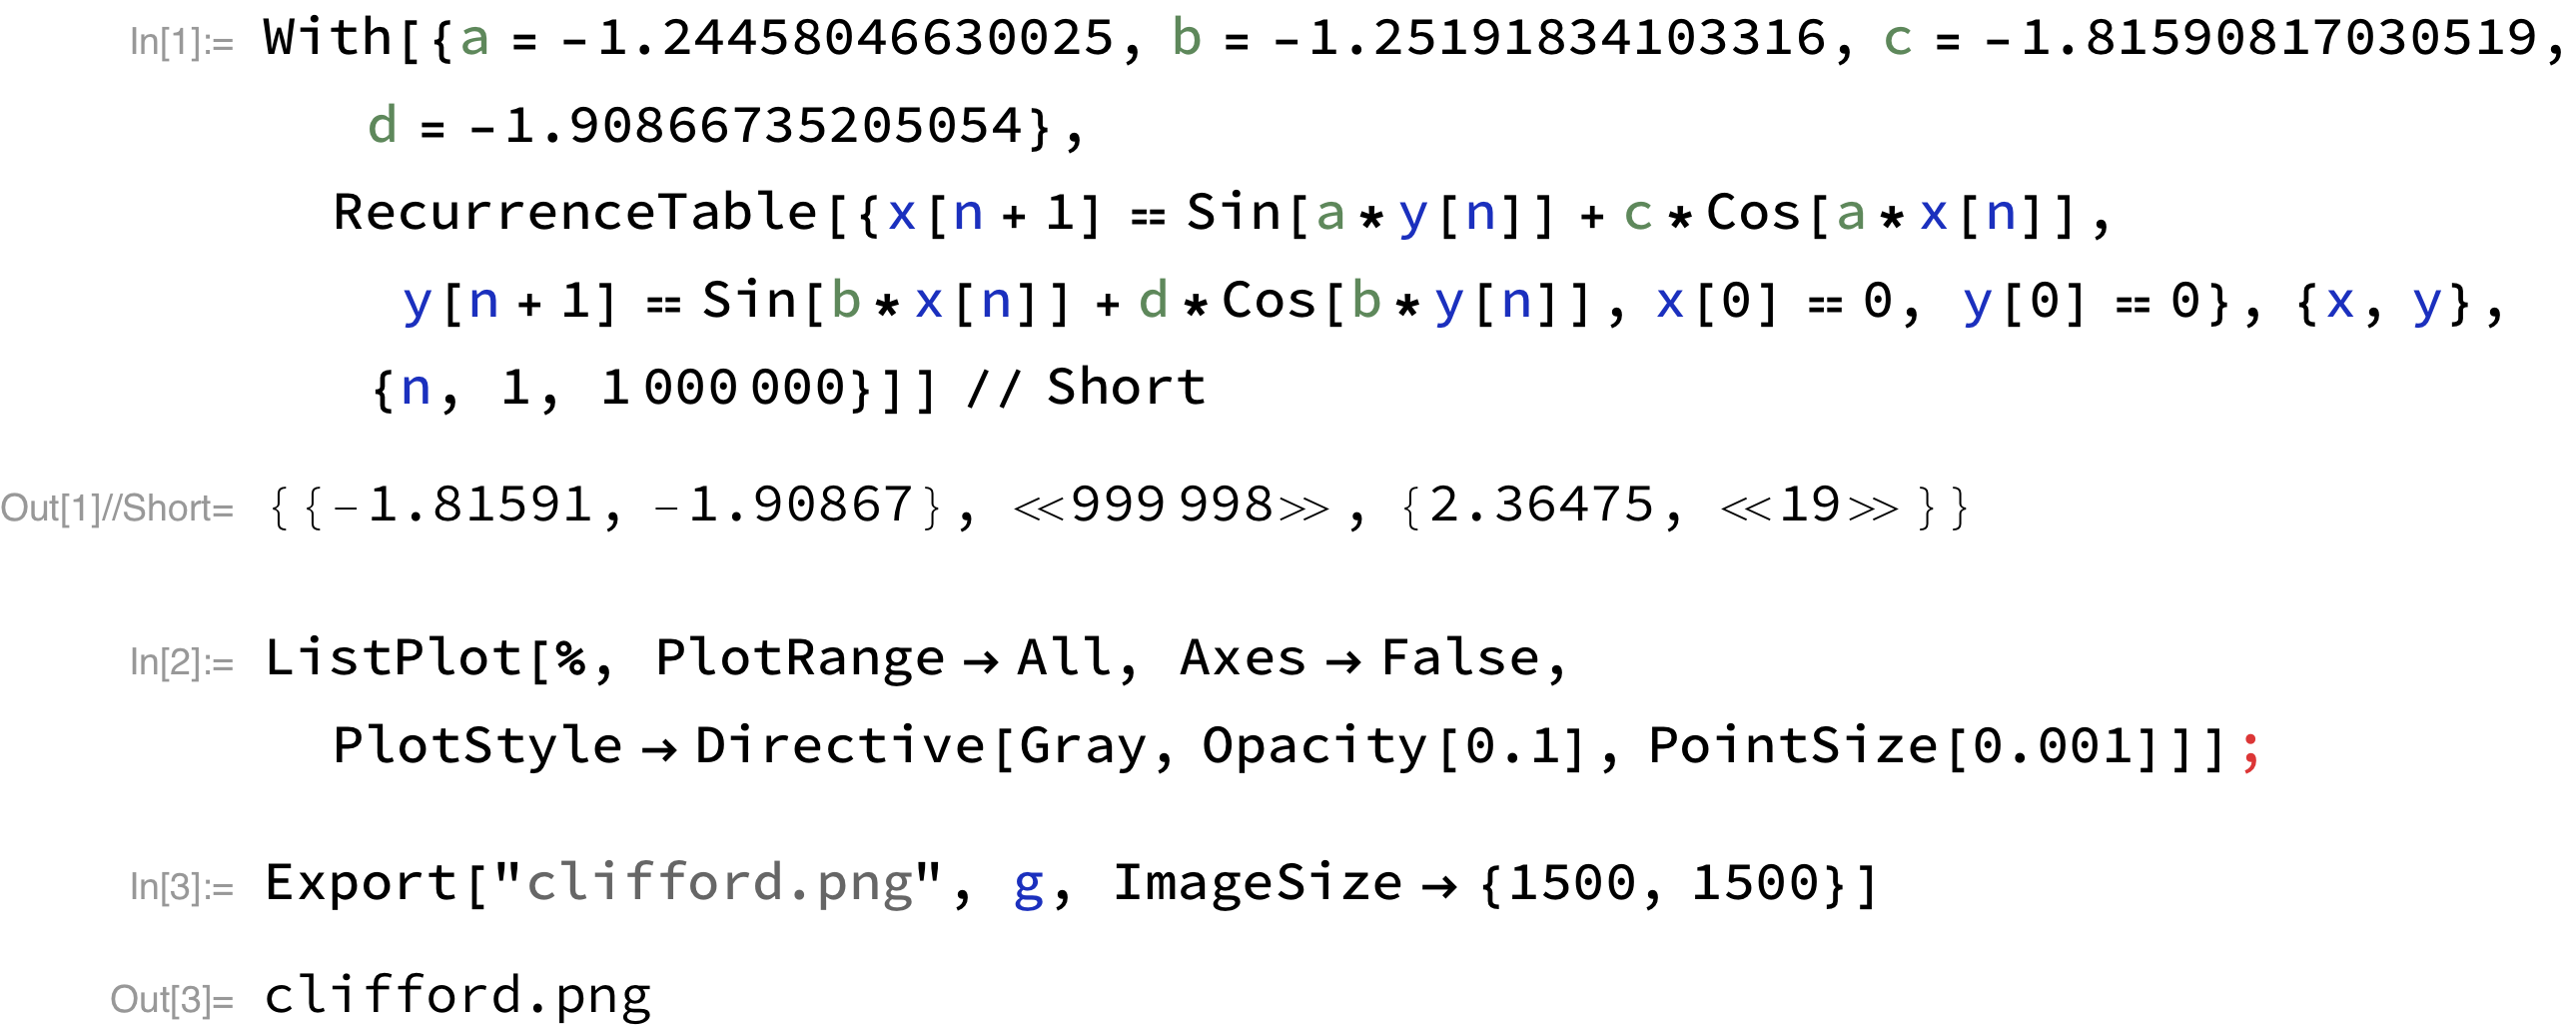
In Mathematica, it is quite easy to define those equations and compute a few values as a function of $n$, or a complete list of $(x,y)$ values for $n$ taking all values in a given range, as illustrated with the following code:

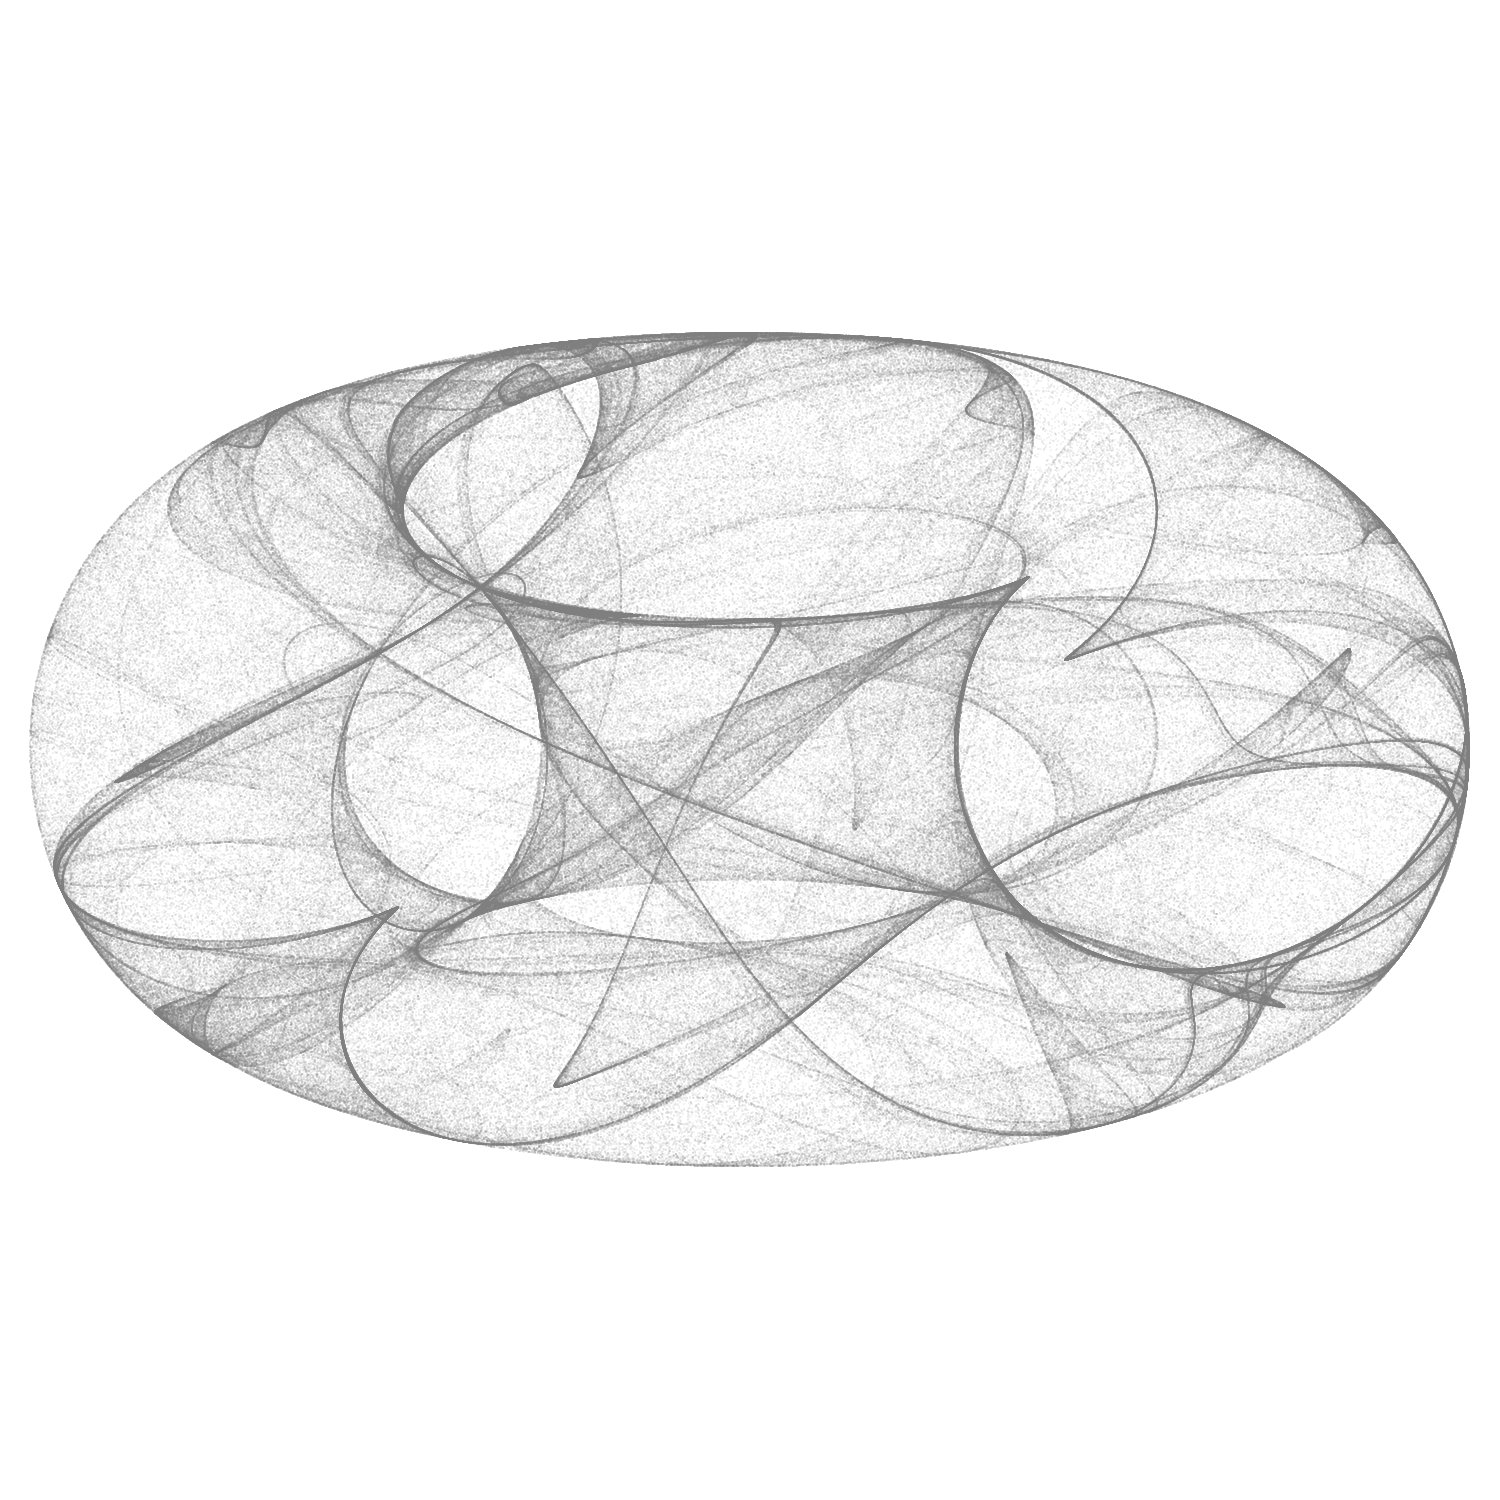
Below is the result (note that this graphic only includes 100,000 data points and the aspect ratio was not modified).

Of course, while digging on Google to find other interesting patterns and the math’ behind them, I happened to find a thread on Stack Exchange, with clever Mathematica code (be sure toc heck the linked thread too!).
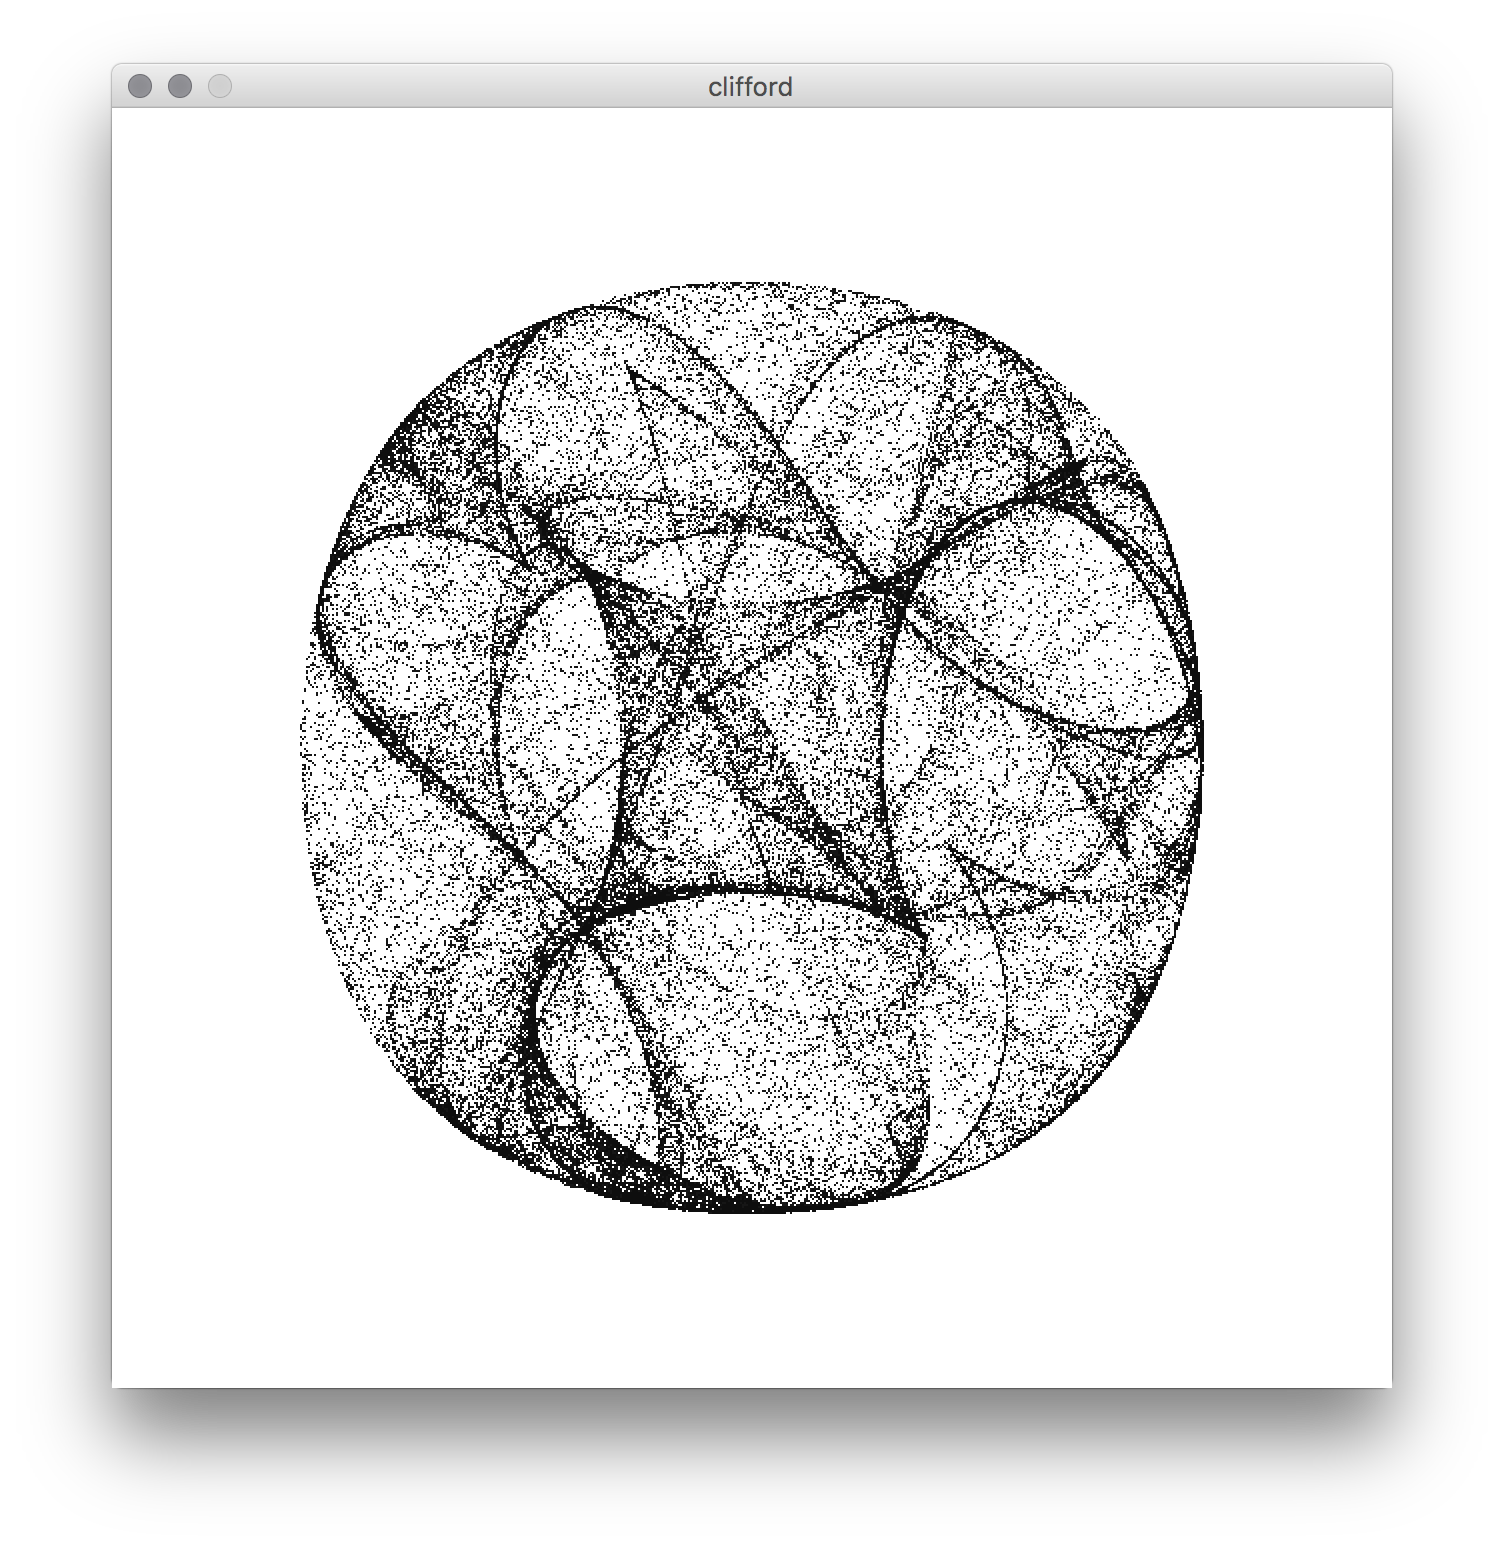
So, here is a simple Processing script. Again, this uses only 100,000 data points but it is easily customizable. Moreover, we could adjust the opacity parameter (see stroke(gray, opacity); here 50/255 ≈ 20%) as a function of the distance to the origin or of the neighborhood density, and so on.
int n = 100000;
float a = -1.24458046630025;
float b = -1.25191834103316;
float c = -1.81590817030519;
float d = -1.90866735205054;
float[] x;
float[] y;
float scale = 80;

void setup() {
  size(640, 640);
  background(255);
  stroke(10, 50);
  x = new float[n];
  y = new float[n];
  x[0] = 0;
  y[0] = 0;
  for (int i = 1; i < n; i++) {
    x[i] = sin(a*y[i-1]) + c*cos(a*x[i-1]);
    y[i] = sin(b*x[i-1]) + d*cos(b*y[i-1]);
  }
}

void draw() {
  for  (int i = 1; i < n; i++) {
    point(x[i] * scale + width/2, y[i] * scale + height/2);
  }
}

♪ London Grammar • Truth is a beautiful thing