Confidence intervals and coverage
A blog post I found in my draft folder which I put here, without further ado.
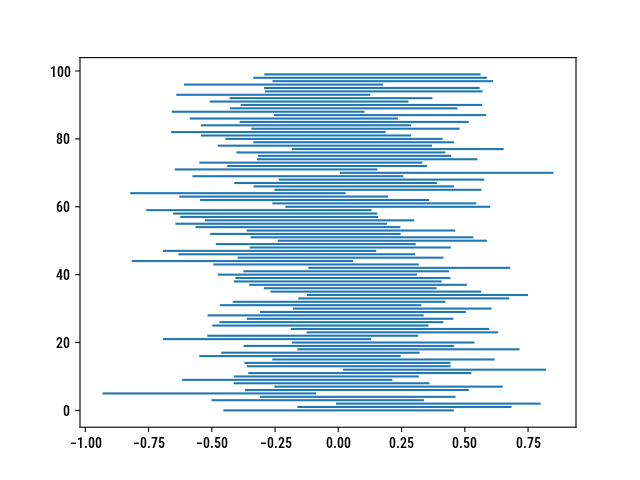
According to the frequentist definition of a confidence interval, the 95% lower and upper bounds can be interpreted as follows: for 100 independent samples, we expect 95 of the CIs to include the true parameter. While I was working on another post, I wrote a quick Python script to estimate how well confidence intervals for a mean or a proportion cover the true parameter value. Since the arithmetic mean applies equally to continuous or binary outcomes (in the latter case, we get the proportion as desired), the code is quite simple. Also note that I use a normal approximation, which may not be that suitable with very small samples. Needless to say, I ended up drafting a little script by the end of August and forgot to highlight misbehaving CIs (i.e., the 5 not so in a row)….
Here is my own implementation, which assumes raw data (i.e., a series of observations for each sample):
import numpy as np
import matplotlib.pyplot as plt
from scipy.stats import norm

def twosamp_ci(xs, ys, level=0.95):
    alpha = 1 - level
    xs, ys = np.asarray(xs), np.asarray(ys)
    nx, ny = xs.shape[0], ys.shape[0]
    px, py = np.mean(xs), np.mean(ys)
    diff = px - py
    if np.unique(xs).shape[0] <= 2:
        se = np.sqrt(px * (1-px)/nx + py * (1-py)/ny)
    else:
        sx = np.std(xs) * np.sqrt(nx/(nx-1))
        sy = np.std(ys) * np.sqrt(ny/(ny-1))
        se = np.sqrt(sx**2/nx + sy**2/ny)

    qz = norm.ppf(1 - alpha /  2)
    lower = diff - qz * se
    upper = diff + qz * se

    return lower, upper

n = 100
iter = 100
cis = {}
for i in range(iter):
    xs = np.random.normal(loc=11, scale=1.5, size=n)
    ys = np.random.normal(loc=11, scale=1.5, size=n)
    cis[i] = twosamp_ci(xs, ys)

y = cis.keys()
x = list(zip(*list(cis.values())))
plt.hlines(y, x[0], x[1])

It could be rewritten without even using Numpy since the math and statistics modules include the stuff we need.
♪ Agnes Obel • Familiar