Collecting email usage statistics from mu
Since I am using mu to manage my email locally, I decided to check some basic information about my email activity during the recent years.
Personal analytics is gaining increased attention, and even Apple now provides iPhone users with the iOS Health App. However, I am more concerned with what information is available directly under my hands, namely my computer. I very much like Seth Brown’s Vim Croquet or Stephen Wolfram’s blog post in this respect. Indeed, they are using basic tools to analyze raw data stored on their computers. Regarding email activity, it is almost impossible to get useful statistics from Apple Mail, although some alternate Mail clients do provide some basic usage statistics. I use both Apple Mail and mu4e under Emacs. At my office, I often have to fetch and process my emails through Gmail web interface. This is not very practical, but I have to live with that.
The mu cheatsheet contains useful queries. For example, to find all messages that include an image as attachment, we can use:
$ mu find 'mime:image/*'
And to find the total number of messages that I sent since the beginning of 2012, I can write:
$ mu find maildir:'/sent' date:20120101..20141025 | wc -l
It is possible to display the name of all messages that match a given criteria, and to process them with other Unix shell utilities, e.g.
$ mu find date:2d..1d --fields="l" | while read filename; do
  cat
done
Finally, the next command allows to view all messages that were sent or received yesterday:
$ mu find maildir:'/sent' date:2d..1d --exec "mu view"
Since mu-find allows to exec anything on the list of messages that are returned by our queries, much like GNU find command, it is probably easier to start with this construction.
Now, let’s compute some simple usage statistics. Here, I would like to analyze:
- The number of messages that I send from my iPhone compared to those sent from a web browser or my local mailing system.
- The number of replies in my ‘sent’ folder.
- How my Gmail ‘Archives’ folder evolve with time.
- How the size of some of my mailboxes evolved with time.
Here is the answer to the first question:
$ mu find maildir:'/sent' date:5y..1d --exec "grep 'X-Mailer:'" | \
  awk '{print $2}' | sort | uniq -c | sort -n -r | head -n 2
2138 Apple
1836 iPhone
$ echo '1836 / 3974' | bc -l | xargs printf "%1.2f\n"
0,46
This suggests that my expectations were quite right, and I am currently processing about half of my incoming emails with my iPhone. (The above command filters out irrelevant mailing software, like Sparrow or MailMate that I tried once a while.)
Regarding my reply rate, here is what I got using:
$ mu find maildir:'/sent' date:5y..1d | wc -l
7747
$ mu find maildir:'/sent' date:5y..1d --exec "grep 'In-Reply-To:'" | wc -l
5165
$ echo '5165 / 7747' | bc -l | xargs printf "%1.2f\n"
0,67
Hence, two thirds of my outgoing emails are in reply to incoming messages.
Regarding question 3, I will limit myself to folders I keep in sync on my HD. Indeed, since Gmail has its own conception of IMAP folders (labels are mapped to IMAP mailboxes, which means that a message can appear in more than one mailbox — in particular, the [Gmail]/All Mail mailbox will duplicate all messages that have archived under specific labels), I decided to fetch only labelled messages (all my messages get a label, whether it be by automatic rules or manual settings), and only specific mailboxes.
$ ls Maildir
INBOX  aphp  cache  cea  cours  drafts  inserm  log  mailing  private
queue  review  sent  trash  xapian
This, however, remains a representative sample of all my emails (about 37k of messages).
$ mu index
indexing messages under /Users/chl/Maildir [/Users/chl/.mu/xapian]
\ processing mail; processed: 37200; updated/new: 0, cleaned-up: 0
cleaning up messages [/Users/chl/.mu/xapian]
| processing mail; processed: 37237; updated/new: 0, cleaned-up: 0
elapsed: 0 second(s)
/ processing mail; processed: 37237; updated/new: 0, cleaned-up: 0
elapsed: 1 second(s), ~ 37237 msg/s
So, here is how I happened to count the number of messages received by month and year:
$ mu find --sortfield=date --fields="d" date:8y..1d | \
  awk -F " " '{print  $5 "-" $3}' | \
  uniq -c | awk '{print $2 " " $1}' > 1.dat
To plot them, I used R with the following program:
d <- read.table("1.dat", header = FALSE)
d$V1 <- paste(d$V1, "15", sep = "-")
d$V1 <- as.Date(as.POSIXct(d$V1, format = "%Y-%b-%d", tz = "GMT"))
names(d) <- c("Time", "Emails")
p <- ggplot(data = d, aes(x = Time, y = Emails)) + geom_line() +
  scale_x_date(breaks = "1 year", minor_breaks = "2 months",
               labels = date_format("%b %Y")) + xlab("")
p + theme_bw()
(The ugly stuff for date conversion is there because I couldn’t make R understand how date were stored as %Y-%b in my FR_UTF8 locale.)

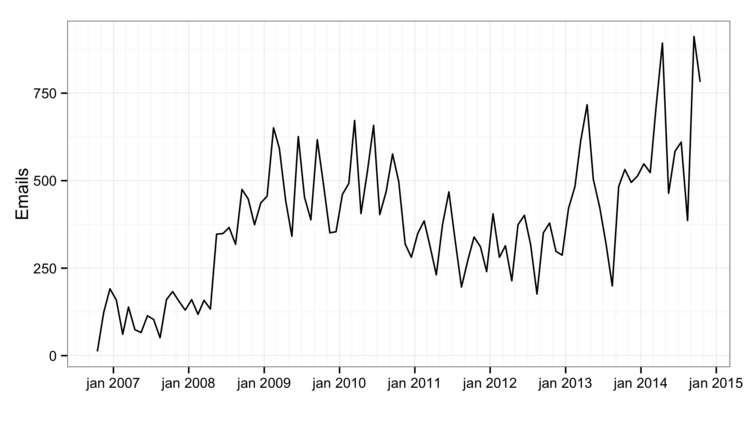
So clearly, my email activity has seriously increased past 2008, that is two years after I got my PhD (part of this may be explained by the fact that I decided to only use my Gmail account for professional use, and no more MS Exchange as I did during 2006-2008.)
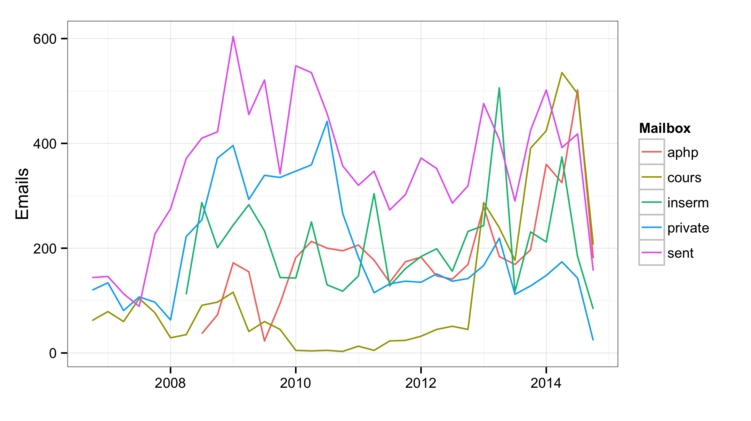
Finally, the same command can easily be updated to get the same summary statistics, aggregated quarterly by year, for some of my mailboxes as shown below:
$ mu find --sortfield=date --fields="d m" date:8y..1d | \
  awk -F " " '{gsub("/", ""); print  $5 "-" $3 " " $6}' | \
  uniq -c | awk '{print $2 " " $1 " " $3}' > 2.dat

I stopped teaching during two years (2010-2012), and I began to work with INSERM and AP-HP shortly after I left my job in psychometrics for educational assessment in 2008. This is nicely reflected in the above picture. Likewise, as I am involved in a MOOC, I receive lot of messages daily via a Google group. However, it was a surprise to notice that the activity in my ‘private’ mailbox dropped suddenly by mid 2011. The overall number of messages I send seems to be around 300-500 messages every three months, which means that I write around 100 emails a month, which is less than I expected. Of course, this only shows part of my mailboxes, and it does not account for the fact that Gmail labels hardly reflect our real activity: for instance, my ‘sent’ mailbox includes messages that are associated to other mailboxes.