Routed Gothic
Today I configured my current main plotting engines (R, Stata and Python) to use the Routed Gothic font. I choose the Narrow variant as it looks prettier for plotting purpose. I discovered this font thanks to Steve Losh, which he now uses with Gnuplot. I like this old design stuff a lot, but it’s definitively not the best font available for plotting as typography-centric themes (e.g., hrbrthemes) usually rely on good kerning and tabular figures. Anyway, I wanted to give it a try for a few weeks and see how it goes. After all it took me a long time to make up my mind to opt for JetBrains Mono after three years of Iosevka.
Using this font in R is not really a problem if you’re using ggplot2 since it comes as a TTF font. It can be used on the fly, when saving PDF files, or as a theming option. I had this in my .Rprofile:
.First <- function() {
  grDevices::quartz.options(width = 6, height = 6)
  grDevices::palette("Tableau10")
  theme_set(theme_light(base_family = "Routed Gothic Narrow"))
}
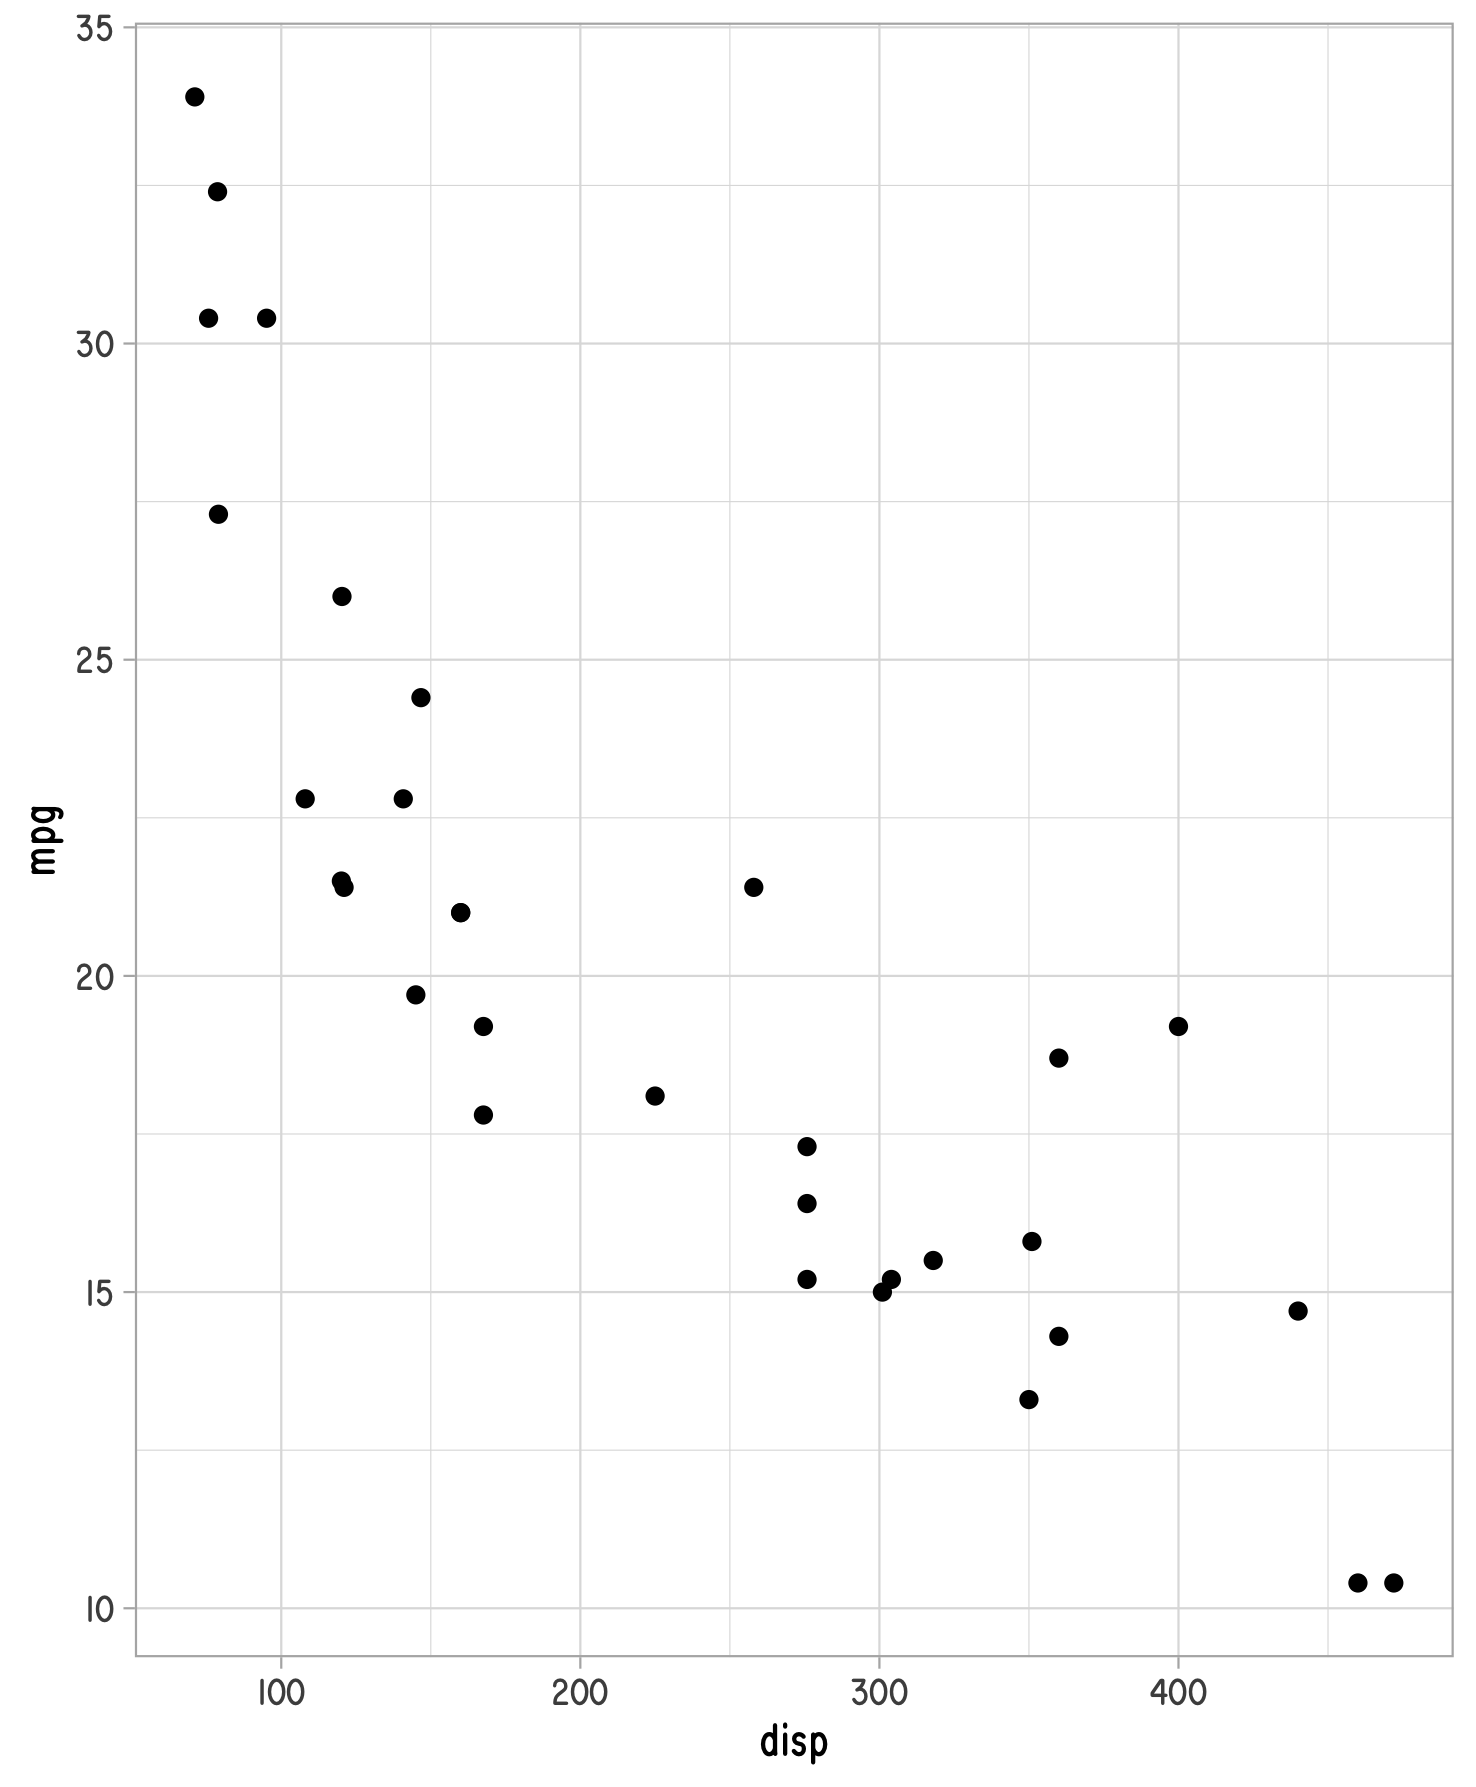
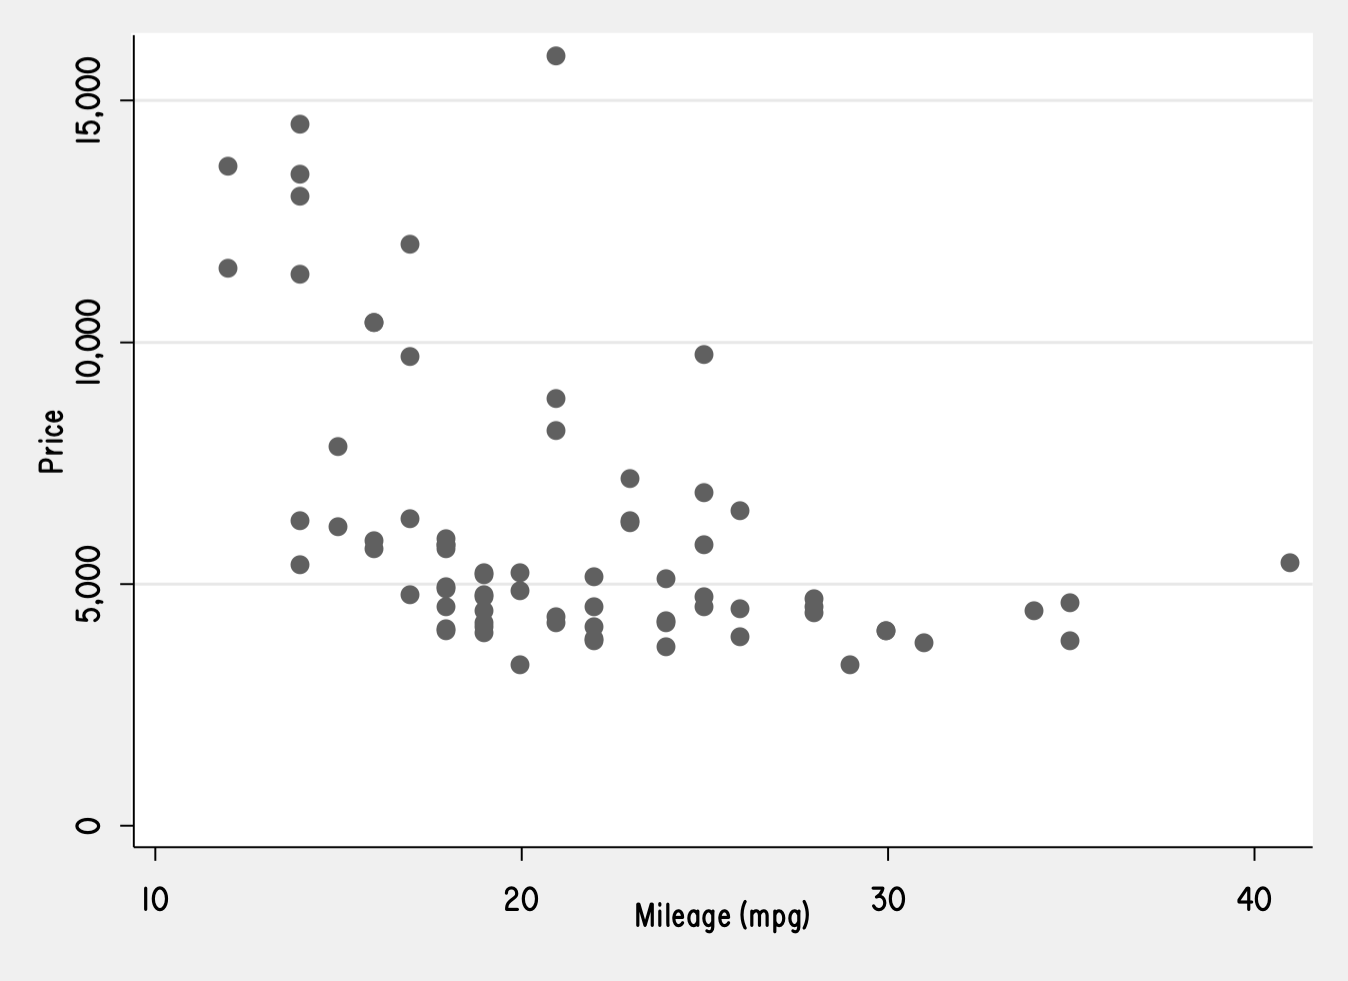
Stata can be configured to use any font you like in your Do-file editor, variable browser/editor, or in the main UI (command + results window). The default font and theme can also be defined for the graphic device. Below is a quick illustration of R and Stata output for the mtcars and auto datasets.
Adding a default font for matplotlib is actually a little bit trickier. I happened to do it as follows:
First, you need to copy the default
matplotlibrcfiel if you haven’t one already under your~/.matplotlibdirectory. For me, it was something like :cp /usr/local/lib/python3.8/site-packages/matplotlib/mpl-data/matplotlibrc .matplotlib.Next, copy the
*.ttffont files in thesite-packages/matplotlib/mpl-data/fonts/ttfdirectory.Finally, edit the
matplotlibrcfile to add the Routed Gothic Narrow font as the first item under thefont.sansentry. Mine now looks as follows:font.sans-serif : Routed Gothic Narrow, DejaVu Sans, Bitstream Vera Sans, Computer Modern Sans Serif, Lucida Grande, Verdana, Geneva, Lucid, Arial, Helvetica, Avant Garde, sans-serifThen, you just have to launch
ipythonwith thematplolibbackend enabled and enjoy your new font settings.1
I’m pretty there is a better option, but this works. That’s it.
I know about various option to have pyplot enabled as an interactive module, but what I use these days is to use a simple startup script located in
.ipython/profile_default/startupwhere I setmatplotlib.interactive(True). ↩︎

